Hi,
I am using the Kelly Criterion to help me determine how much risk I should take in each trade, according to my win/loss ratio and winning probability (based on my track record). A concise and well written explanation of the method may be found here:
http://www.investopedia.com/articles...#axzz1bycGZb51
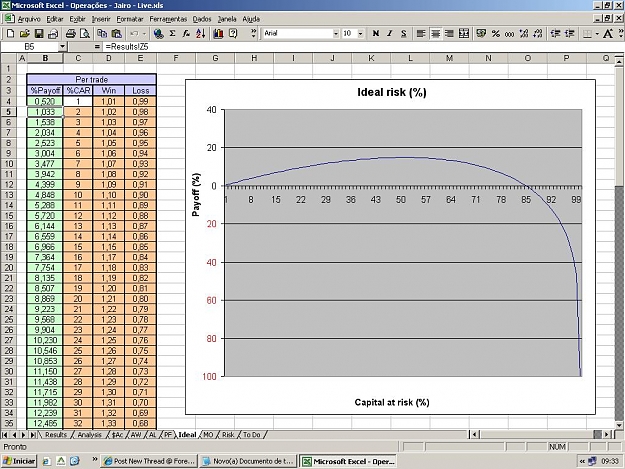
I have created an Excel spreadsheet that plots the expected % Payoff on each trade against the % Capital at risk according to the criterion. I know that taking the optimum risk pointed out may not be the best choice, so I always consider taking a fraction of it, using the optimum level as a reference.
The reason for starting this thread is that I am trying to figure out how to calculate the probability of a certain % drawdown against a chosen risk level. It is not just the compounded probability of a string of losses leading to the target drawdown. There may be winners among the losers - shifting the odds - so here I am trying to push the limits of my math background.
Attached is a screenshot of the %Payoff x %CAR plot from my spreadsheet. If there is anybody interested (or willing to help me) I may post the spreadsheet as well. Thanks and good trading to all.
I am using the Kelly Criterion to help me determine how much risk I should take in each trade, according to my win/loss ratio and winning probability (based on my track record). A concise and well written explanation of the method may be found here:
http://www.investopedia.com/articles...#axzz1bycGZb51
I have created an Excel spreadsheet that plots the expected % Payoff on each trade against the % Capital at risk according to the criterion. I know that taking the optimum risk pointed out may not be the best choice, so I always consider taking a fraction of it, using the optimum level as a reference.
The reason for starting this thread is that I am trying to figure out how to calculate the probability of a certain % drawdown against a chosen risk level. It is not just the compounded probability of a string of losses leading to the target drawdown. There may be winners among the losers - shifting the odds - so here I am trying to push the limits of my math background.
Attached is a screenshot of the %Payoff x %CAR plot from my spreadsheet. If there is anybody interested (or willing to help me) I may post the spreadsheet as well. Thanks and good trading to all.
Attached Image (click to enlarge)