• Home
  • Forums
  • News
  • Calendar
  • Market
  • Login
  • Join
  • User/Email: Password:
  • 12:12pm
Menu
  • Forums
  • News
  • Calendar
  • Market
  • Login
  • Join
  • 12:12pm
Sister Sites
  • Energy EXCH
  • Crypto Craft
  • Forex Factory

Options

Bookmark Thread

First Page First Unread Last Page Last Post

Print Thread

Similar Threads

Spot gold EA from OG gold system 8 replies

Rick Rule – Triple Gold Demand 0 replies

how can I know supply and demand in gold 2 replies

Gold Miner - Gold future support and resistance level trade 7 replies

  • Commercial Content
  • /
  • Reply to Thread
  • Subscribe
  • 686
Attachments: Ollio's Gold - Supply and Demand
Exit Attachments

Ollio's Gold - Supply and Demand

  • Last Post
  •  
  • 1 23Page 456 74
  • 1 3Page 45 74
  •  
  • Post #61
  • Quote
  • Apr 10, 2014 8:24am Apr 10, 2014 8:24am
  •  jackeollio
  • | Commercial Member | Joined Feb 2014 | 1,077 Posts
Quoting amansuri1
Disliked
{quote} thanks for the suggestion buddy and shud open new long there, do u think that wud be a good idea, thnx
Ignored
Look at my charts below.

On the 4 Hour, Demand is @1317.73 and we are Long above 1322.74.

On the 8 Hour, Demand is @1316.97 and we are Long above 1322.06.

As mentioned before, on the Day chart we are Long above 1317.55.

Your pick my friend.

My very best to you.
Attached Image (click to enlarge)
Click to Enlarge

Name: FIA - Gold 10-04-2014 (36-2).PNG
Size: 25 KB
Using the FIA, traders need only "Sell the Highs" & "Buy the Lows".
 
 
  • Post #62
  • Quote
  • Apr 10, 2014 8:34am Apr 10, 2014 8:34am
  •  amansuri1
  • | Joined Apr 2011 | Status: Member | 325 Posts
Quoting jackeollio
Disliked
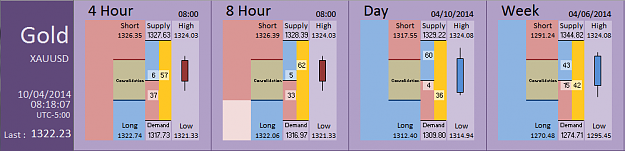
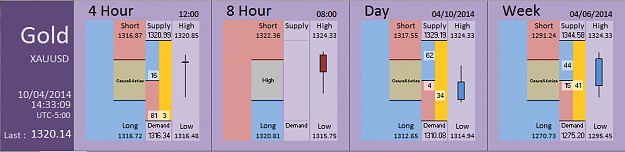
{quote} Look at my charts below. On the 4 Hour, Demand is @1317.73 and we are Long above 1322.74. On the 8 Hour, Demand is @1316.97 and we are Long above 1322.06. As mentioned before, on the Day chart we are Long above 1317.55. Your pick my friend. My very best to you. {image}
Ignored
thanks for the support bro
 
 
  • Post #63
  • Quote
  • Apr 10, 2014 8:46am Apr 10, 2014 8:46am
  •  tripr
  • | Joined Jan 2014 | Status: Member | 249 Posts
targets for the longs would then be the supply #'s on those respective charts, correct jacke ?
 
 
  • Post #64
  • Quote
  • Apr 10, 2014 8:58am Apr 10, 2014 8:58am
  •  jackeollio
  • | Commercial Member | Joined Feb 2014 | 1,077 Posts
Quoting tripr
Disliked
targets for the longs would then be the supply #'s on those respective charts, correct jacke ?
Ignored
Good point.

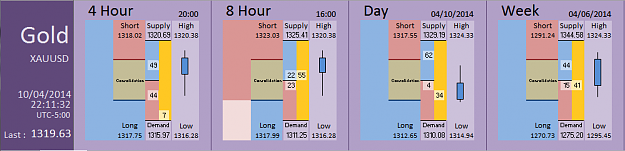
Notice the 4 Hour and 8 Hour charts indicate the direction of the market is Bearish as indicated by the left hand column (i.e. being Redish Pink or Pinkish Red).

The second column indicates Traders are waiting to Short the instrument @1326.35 et 1326.39 respectively.

Accordingly, your Targets would be near (i.e. somewhere lower than) the Short levels as opposed to being the Supply levels themselves.

Had the left hand column indicated a Bullish market on the 4 Hour and the 8 Hour charts, your Targets are more likely between Short levels and Supply levels of the same.
Using the FIA, traders need only "Sell the Highs" & "Buy the Lows".
 
 
  • Post #65
  • Quote
  • Apr 10, 2014 9:02am Apr 10, 2014 9:02am
  •  tripr
  • | Joined Jan 2014 | Status: Member | 249 Posts
I see, thanks for the heads up !
 
 
  • Post #66
  • Quote
  • Apr 10, 2014 9:22am Apr 10, 2014 9:22am
  •  jackeollio
  • | Commercial Member | Joined Feb 2014 | 1,077 Posts
Next post of the day.

For those of you who have been watching lately, we have the same little song and dance as yesterday.

Notice the Retracement Levels on the 4 Hour and 8 Hour charts. These suggest that it is not time to enter the market Long quite yet.

Thursday, April 10, 2014
Attached Image (click to enlarge)
Click to Enlarge

Name: FIA - Gold 10-04-2014 (36-3).PNG
Size: 27 KB
Using the FIA, traders need only "Sell the Highs" & "Buy the Lows".
 
 
  • Post #67
  • Quote
  • Apr 10, 2014 9:31am Apr 10, 2014 9:31am
  •  tripr
  • | Joined Jan 2014 | Status: Member | 249 Posts
why not be long ? not sure I follow. other than the short levels have dropped quite a bit to the current levels on the 4h and 8h.
 
 
  • Post #68
  • Quote
  • Apr 10, 2014 9:35am Apr 10, 2014 9:35am
  •  jackeollio
  • | Commercial Member | Joined Feb 2014 | 1,077 Posts
Quoting tripr
Disliked
why not be long ? not sure I follow. other than the short levels have dropped quite a bit to the current levels on the 4h and 8h.
Ignored
Simply because the 4 Hour and 8 Hour continue to maintain, at least for the moment, Bearish pressure on the instrument.
Using the FIA, traders need only "Sell the Highs" & "Buy the Lows".
 
 
  • Post #69
  • Quote
  • Apr 10, 2014 9:42am Apr 10, 2014 9:42am
  •  tripr
  • | Joined Jan 2014 | Status: Member | 249 Posts
I keep forgetting the part on the left of your charts. just pulled my targets down to the lower levels and may just scratch it if PA deteriorates. I got to wake and look at the whole picture.
 
 
  • Post #70
  • Quote
  • Edited at 2:40pm Apr 10, 2014 12:18pm | Edited at 2:40pm
  •  jackeollio
  • | Commercial Member | Joined Feb 2014 | 1,077 Posts
Next posts for today.

Chart #2

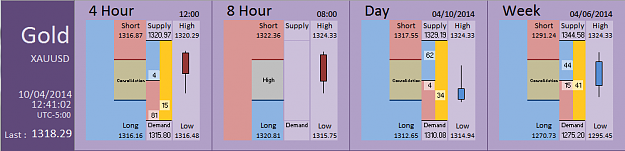
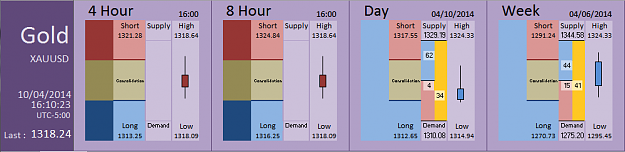
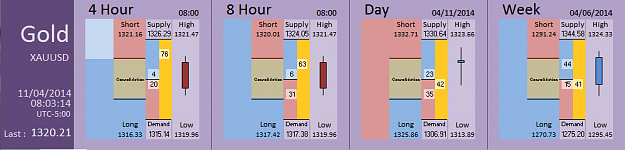
Notice the Active Consolidation Zone on the second chart below as the market remains simultaneously Bullish above 1316.87 on the 4 Hour chart and Bearish below 1320.81 on the 8 Hour chart. The Supply level of the 4 Hour chart @1320.97 is almost equal to the Long level of the 8 Hour chart @1320.81 which is the upper boundary of the Active Consolidation Zone.

Chart #3

The percentage appearing on the Yellow Bar of the 4 Hour chart indicates that only 3% of the gap between Supply and Demand remains Unfilled.

Thursday, April 10, 2014
Attached Images (click to enlarge)
Click to Enlarge

Name: FIA - Gold 10-04-2014 (36-6).PNG
Size: 27 KB Click to Enlarge

Name: FIA - Gold 10-04-2014 (36-7).PNG
Size: 27 KB Click to Enlarge

Name: FIA - Gold 10-04-2014 (36-8).PNG
Size: 27 KB
Using the FIA, traders need only "Sell the Highs" & "Buy the Lows".
 
 
  • Post #71
  • Quote
  • Apr 10, 2014 2:49pm Apr 10, 2014 2:49pm
  •  tripr
  • | Joined Jan 2014 | Status: Member | 249 Posts
so, this means the market is running out of sellers and the low for the 4h chart is in, yes ?
 
 
  • Post #72
  • Quote
  • Apr 10, 2014 3:01pm Apr 10, 2014 3:01pm
  •  jackeollio
  • | Commercial Member | Joined Feb 2014 | 1,077 Posts
Quoting tripr
Disliked
so, this means the market is running out of sellers and the low for the 4h chart is in, yes ?
Ignored
You got it.

We now need to see what we get at 16:00 UTC-5:00 on the 8 Hour chart.
Using the FIA, traders need only "Sell the Highs" & "Buy the Lows".
 
 
  • Post #73
  • Quote
  • Apr 10, 2014 3:08pm Apr 10, 2014 3:08pm
  •  tripr
  • | Joined Jan 2014 | Status: Member | 249 Posts
are you trading other mkts. with this methodology ? if so, would love to see the #'s on crude oil and e-mini's.
 
 
  • Post #74
  • Quote
  • Edited at 10:14pm Apr 10, 2014 4:11pm | Edited at 10:14pm
  •  jackeollio
  • | Commercial Member | Joined Feb 2014 | 1,077 Posts
Last series of posts for today.

Thursday, April 10, 2014
Attached Images (click to enlarge)
Click to Enlarge

Name: FIA - Gold 10-04-2014 (36-9).PNG
Size: 26 KB Click to Enlarge

Name: FIA - Gold 10-04-2014 (36-10).PNG
Size: 26 KB Click to Enlarge

Name: FIA - Gold 10-04-2014 (36-11).PNG
Size: 26 KB Click to Enlarge

Name: FIA - Gold 10-04-2014 (36-12).PNG
Size: 26 KB
Using the FIA, traders need only "Sell the Highs" & "Buy the Lows".
 
 
  • Post #75
  • Quote
  • Edited at 5:11pm Apr 10, 2014 4:14pm | Edited at 5:11pm
  •  jackeollio
  • | Commercial Member | Joined Feb 2014 | 1,077 Posts
Quoting tripr
Disliked
are you trading other mkts. with this methodology ? if so, would love to see the #'s on crude oil and e-mini's.
Ignored
I do.

That is one of the key advantages of trading with my application.

There are currently no limitations as to the number of instruments or timeframes.

I never have to do any technical analysis.
Using the FIA, traders need only "Sell the Highs" & "Buy the Lows".
 
 
  • Post #76
  • Quote
  • Apr 10, 2014 4:43pm Apr 10, 2014 4:43pm
  •  tripr
  • | Joined Jan 2014 | Status: Member | 249 Posts
yep, supply and demand is what makes all mkts. go round and round. are we going to be looking at some other mkts. during the webinar ?
 
 
  • Post #77
  • Quote
  • Apr 10, 2014 4:47pm Apr 10, 2014 4:47pm
  •  jackeollio
  • | Commercial Member | Joined Feb 2014 | 1,077 Posts
Quoting tripr
Disliked
yep, supply and demand is what makes all mkts. go round and round. are we going to be looking at some other mkts. during the webinar ?
Ignored
We sure will.

If you wish, you can give me your suggestions.
Using the FIA, traders need only "Sell the Highs" & "Buy the Lows".
 
 
  • Post #78
  • Quote
  • Apr 10, 2014 4:55pm Apr 10, 2014 4:55pm
  •  tripr
  • | Joined Jan 2014 | Status: Member | 249 Posts
I trade futures primarily so would like to see crude oil, s & p e-minis, maybe one or two of the ags as well gold and maybe silver. I'm sure you will get some requests from others on the forex pairs. I like what your doing and am thrilled to have the opportunity to learn more. when and at what time are you looking at having the webinar and will it be recorded ?
 
 
  • Post #79
  • Quote
  • Apr 11, 2014 4:55am Apr 11, 2014 4:55am
  •  amansuri1
  • | Joined Apr 2011 | Status: Member | 325 Posts
hi jack any update for today, thnx
 
 
  • Post #80
  • Quote
  • Edited at 2:38pm Apr 11, 2014 6:10am | Edited at 2:38pm
  •  jackeollio
  • | Commercial Member | Joined Feb 2014 | 1,077 Posts
Friday April 11, 2014

Chart #1

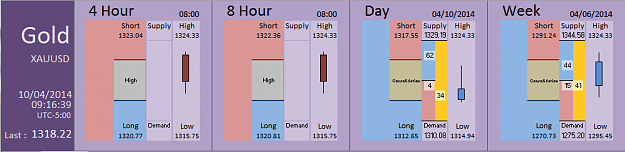
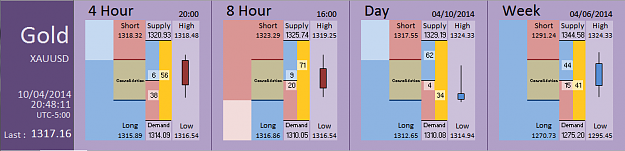
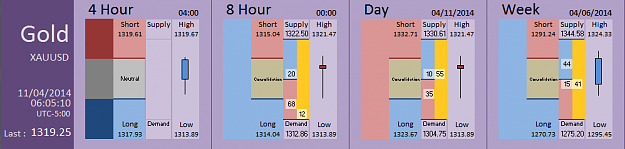
The market is currently in an Active Consolidation Zone as it is simultaneously Bullish above 1315.04 on the 8 Hour timeframe and Bearish below 1323.67 on the Day timeframe.

Chart #2

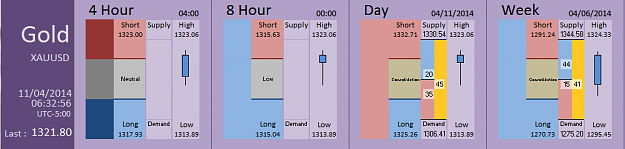
Notice the changes from the previous chart on the 8 Hour and Day timeframes. On the 8 Hour, (1) Demand has overcome Supply such that we now have a Low, (2) we have a Retracement Level @1315.63. The Day is now Bearish below 1325.26.

Chart #3

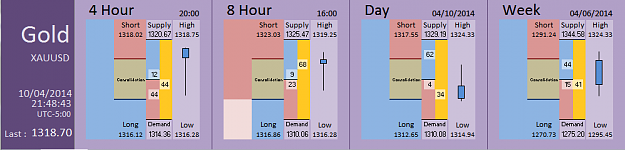
We have an Active Consolidation Zone as the market is simultaneously Bullish above 1320.01 on the 8 Hour timeframe and Bearish below 1325.86 on the Day timeframe.
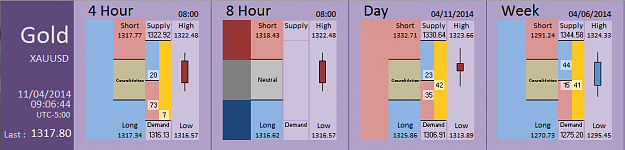
Chart #4

The 4 Hour chart now indicates the market is Bullish above 1317.77 while the 8 Hour chart is Neutral and the Day chart is Bearish below 1325.86. We have a new Active Consolidation Zone which is now between the 4 Hour chart, Bullish above 1317.77 and the Day chart, Bearish below 1325.86. To invalidate the new Active Consolidation Zone, the market needs to push below the Demand level on the 4 Hour chart @1316.13.
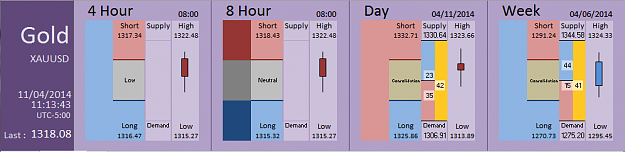
Chart #5

On the 4 Hour chart, Demand has overcome Supply such that we now have a Low. On the 8 Hour chart the market is Neutral between 1318.43 and 1315.32. The Day remains Bearish below 1325.86.
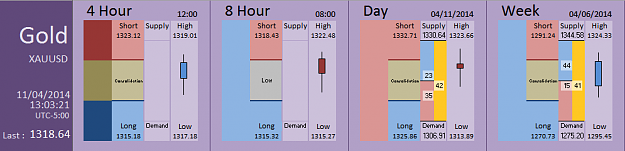
Chart #6 (Last)

On the 4 Hour chart, the market is in a Passive Consolidation Zone between 1323.12 and 1315.18. On the 8 Hour chart, Demand has overcome Supply such that we have a Low. The Day remains Bearish below 1325.86.
Attached Images (click to enlarge)
Click to Enlarge

Name: FIA - Gold 11-04-2014 (37-1).PNG
Size: 26 KB Click to Enlarge

Name: FIA - Gold 11-04-2014 (37-2).PNG
Size: 27 KB Click to Enlarge

Name: FIA - Gold 11-04-2014 (37-3).PNG
Size: 26 KB Click to Enlarge

Name: FIA - Gold 11-04-2014 (37-7).PNG
Size: 27 KB
Click to Enlarge

Name: FIA - Gold 11-04-2014 (37-8).PNG
Size: 27 KB Click to Enlarge

Name: FIA - Gold 11-04-2014 (37-9).PNG
Size: 26 KB
Using the FIA, traders need only "Sell the Highs" & "Buy the Lows".
 
 
  • Commercial Content
  • /
  • Ollio's Gold - Supply and Demand
  • Reply to Thread
    • 1 23Page 456 74
    • 1 3Page 45 74
0 traders viewing now
  • More
Top of Page
  • Facebook
  • Twitter
About MM
  • Mission
  • Products
  • User Guide
  • Blog
  • Contact
MM Products
  • Forums
  • Calendar
  • News
  • Market
MM Website
  • Homepage
  • Search
  • Members
  • Report a Bug
Follow MM
  • Facebook
  • Twitter

MM Sister Sites:

  • Energy EXCH
  • Crypto Craft
  • Forex Factory

Metals Mine™ is a brand of Fair Economy, Inc.

Terms of Service / ©2022