wow, very cool, must have taken a good while to put it all together. so, is this something that can be taught to others and implemented somehow using a particular software program and/or charting package or is this strictly to be used as a signals based program that you plan to market to the public or what exactly ?
wow, very cool, must have taken a good while to put it all together. so, is this something that can be taught to others and implemented somehow using a particular software program and/or charting package or is this strictly to be used as a signals based program that you plan to market to the public or what exactly ?
Ignored
Sorry tripr, was busy doing stuff for a while.
Good question, at present I'm not quite sure what my answer should be.
I do have plans to do something or another, but nothing definitive yet.
Using the FIA, traders need only "Sell the Highs" & "Buy the Lows".
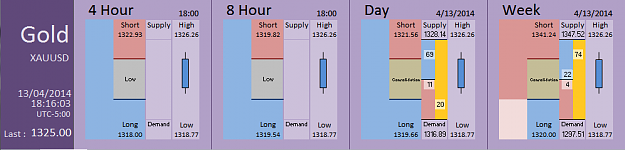
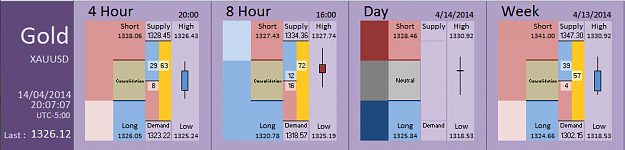
On the 4 Hour timeframe, (1) Demand has overcome Supply such that we have a Low, (2) the Retracement Level is 1322.93. Similarly, on the 8 Hour timeframe (1) Demand has overcome Supply and we also have a Low, (2) the Retracement Level is 1319.82. The Day is Bullish above 1321.56. The Week has a Bearish Bias below 1341.24. The Week is currently Bullish within it's Consolidation Zone.
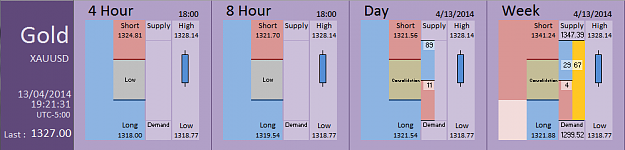
Chart #2 (Last)
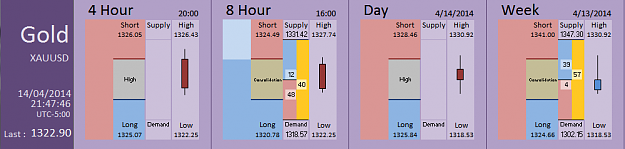
The Retracement Levels on the 4 Hour and 8 Hour timeframes are now 1324.81 and 1321.70 respectively. On the Day timeframe, (1) the fields for Supply and Demand are now Blank, (2) there is no more Yellow Bar which indicates the Unfilled Gap Percentage (i.e. 0% remains unfilled). On the Week, (1) we have a Bearish Bias below 1341.24 (upper boundary of the Consolidation Zone), (2) the Bullish Percentage Indicator (i.e. blue bar) is equal to 29%, (3) the Bearish Percentage Indicator (i.e. pinkish red bar) is equal to 4%, (3) the Unfilled Gap Percentage Indicator is equal to 67%.
Attached Image(s) (click to enlarge)
Using the FIA, traders need only "Sell the Highs" & "Buy the Lows".
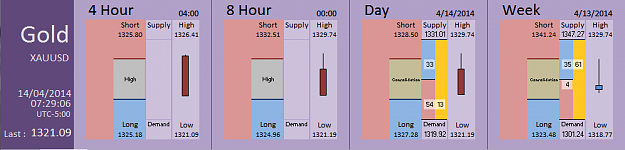
On the daily time frame gap has been filled at 1328.14 , am i right ?
Ignored
You are correct, the gap will have been filled (100%) on the Day timeframe when the market reaches 1328.14.
At that point, there will be no number on the Yellow bar and the Supply and Demand fields will both be Blank (see Chart #2 above).
Should the market move higher than 1328.14, the Day timeframe will indicate that we have a Low and it will calculate the Retracement Level on that timeframe.
Using the FIA, traders need only "Sell the Highs" & "Buy the Lows".
We have been testing a new web conferencing software and expect to complete this week.
So we should be having the webinar shortly thereafter.
The good news is that I will be giving access to my software as a cloud based service to people who have attended the webinar. At first the service will be limited to no more than 10 at once but I plan on increasing that to include everyone.
Using the FIA, traders need only "Sell the Highs" & "Buy the Lows".
{quote} Hi pips777, no you haven't. We have been testing a new web conferencing software and expect to complete this week. So we should be having the webinar shortly thereafter. The good news is that I will be giving access to my software as a cloud based service to people who have attended the webinar. At first the service will be limited to no more than 10 at once but I plan on increasing that to include everyone.
{quote} Hi pips777, no you haven't. We have been testing a new web conferencing software and expect to complete this week. So we should be having the webinar shortly thereafter. The good news is that I will be giving access to my software as a cloud based service to people who have attended the webinar. At first the service will be limited to no more than 10 at once but I plan on increasing that to include everyone.
Ignored
hi jack
I really anxious for your webinar very much, I hope we'll be able to calculate your externally fascinate chart by our-self
hopefully
{quote} I'm not sure what you're trying to say. But if you're asking me if I will be teaching you how to calculate the Supply and Demand Levels, the answer is unequivocally no. What I will be teaching you is how to interpret the information provided by my software.
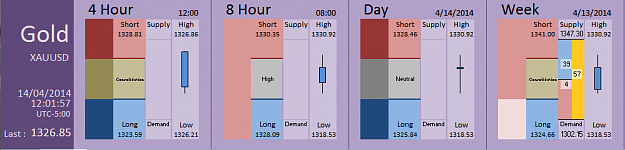
On the 4 Hour, (1) Supply has overcome Demand such that we have a High, (2) the market is Bearish below the Retracement Level @1325.18. On the 8 Hour, (1) Supply has overcome Demand such that we have a High, (2) the market is Bearish below the Retracement Level @1324.96. On the Day, the market is Bearish below 1327.28. On the Week, the market is Bearish below 1323.48.
Chart #2
On the 4 Hour, the market is Bullish above 1321.96. On the 8 Hour, the market has a Bearish Bias below 1331.36 (i.e. upper boundary of the Passive Consolidation Zone). On the Day, the market is Bearish below 1327.28. On the Week the market remains Bearish below 1323.48.
Chart #3
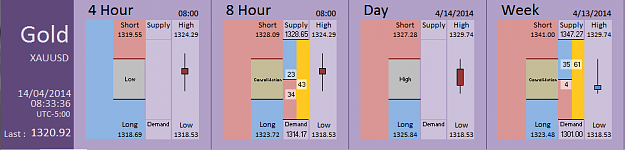
On the 4 Hour, (1) Demand has overcome Supply such that we have a Low, (2) we have a Retracement Level @1319.55. On the 8 Hour, the market is Bearish below 1323.72. On the Day, (1) Supply has overcome Demand such that we have a High, (2) we have a Retracement Level @1325.84. The Week remains Bearish below 1323.48.
Chart #4
On the 4 Hour, (1) Demand has overcome Supply such that we have a Low, (2) we have a Retracement Level @1321.77. On the 8 Hour, the market is now Bearish below 1325.94. We are now Neutral between 1327.28 and 1325.84 on the Day. On the Week, the market is back to a Bearish Bias as we have returned into the Passive Consolidation Zone.
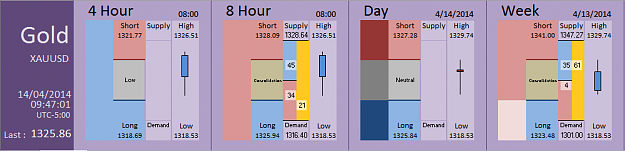
Chart #5
On the 4 Hour, (1) Demand has overcome Supply such that we have a Low, (2) we have a Retracement Level @1324.23. On the 8 Hour, the market is Neutralbetween 1328.40 and 1328.09. On the Day, (1) Demand has overcome Supply such that we have a Low, (2) we have a Retracement Level @1327.28. The Week remains with a Bearish Bias below 1341.00 (i.e. upper boundary of the Passive Consolidation Zone).
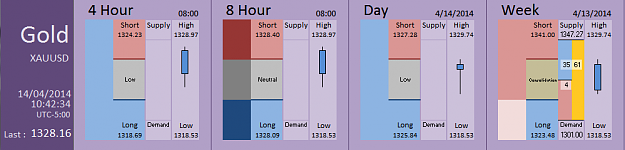
Chart #6
On the 4 Hour, the market is in a Passive Consolidation Zone between 1328.81 and 1323.59. On the 8 Hour, (1) Supply has overcome Demand such that we have a High, (2) we have a Retracement Level @1328.09. The Day is now Neutral between 1328.46 and 1325.84. The Week, (1) remains within it's Passive Consolidation Zone with a Bearish Bias below 1341.00, (2) the Unfilled Gap Percentage indicator now reads 57%.
Chart #7
Chart #8 (Last)
Attached Image(s) (click to enlarge)
Using the FIA, traders need only "Sell the Highs" & "Buy the Lows".