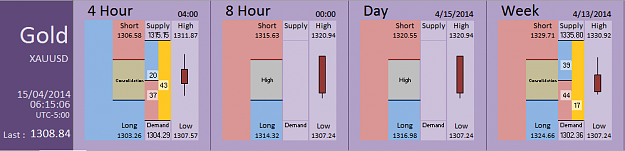
Seems that the market is pushing the price deep to close that gap in weekly time frame .

- #102
- Apr 14, 2014 9:59am Apr 14, 2014 9:59am
- | Commercial User | Joined Feb 2014 | 1,077 Posts
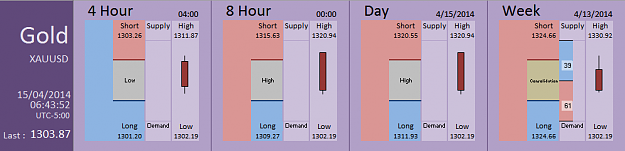
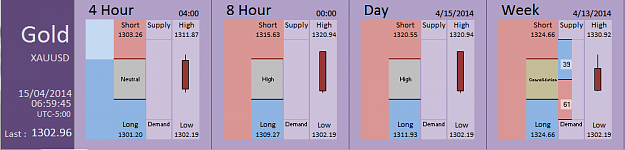
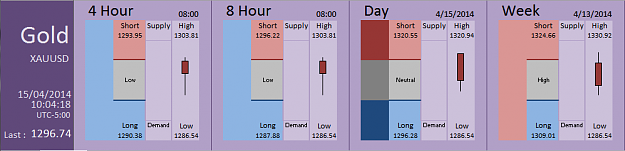
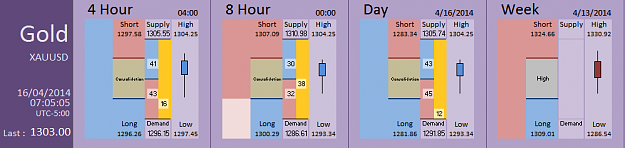
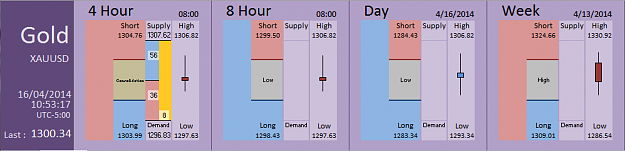
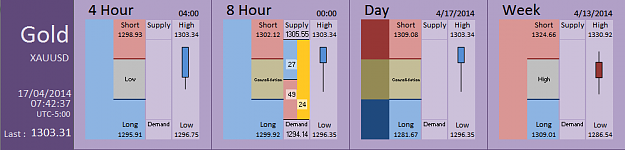
Using the FIA, traders need only "Sell the Highs" & "Buy the Lows".
- #103
- Apr 14, 2014 10:34am Apr 14, 2014 10:34am
- | Additional Username | Joined Apr 2014 | 1,312 Posts
- #104
- Apr 14, 2014 10:39am Apr 14, 2014 10:39am
- | Commercial User | Joined Feb 2014 | 1,077 Posts
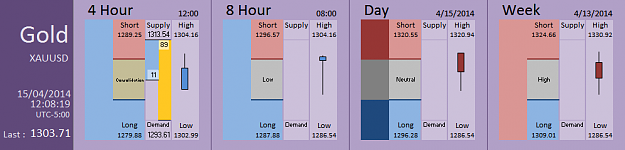
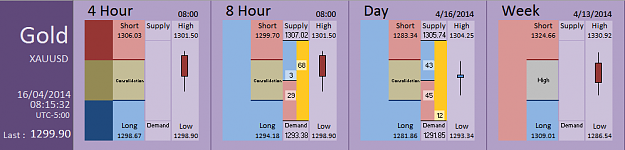
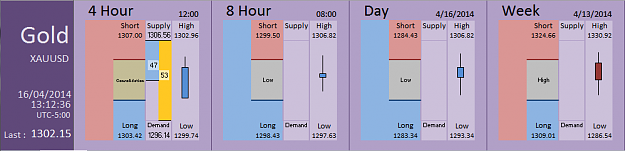
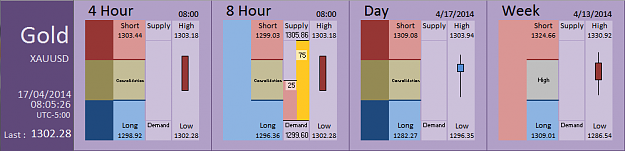
Using the FIA, traders need only "Sell the Highs" & "Buy the Lows".
- #105
- Edited 3:56pm Apr 15, 2014 4:23am | Edited 3:56pm
- | Commercial User | Joined Feb 2014 | 1,077 Posts
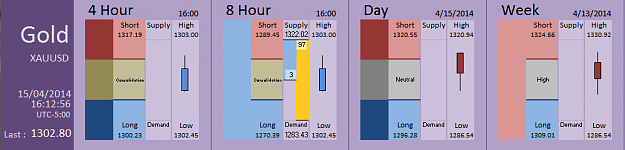
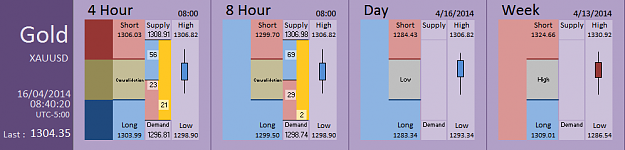
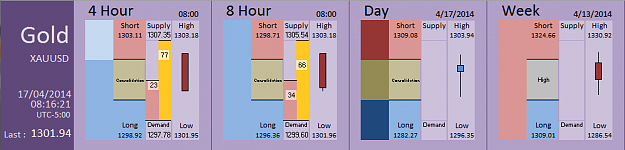
Using the FIA, traders need only "Sell the Highs" & "Buy the Lows".
- #107
- Apr 15, 2014 8:08am Apr 15, 2014 8:08am
- | Commercial User | Joined Feb 2014 | 1,077 Posts
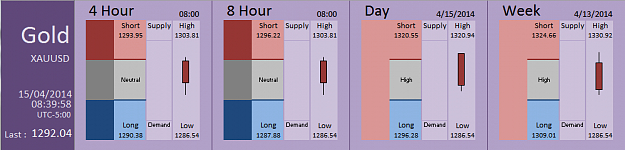
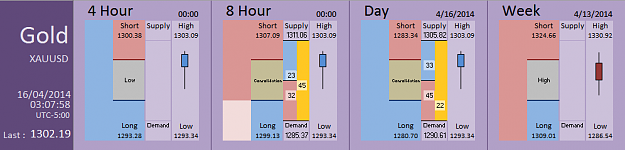
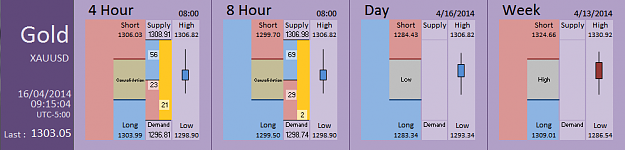
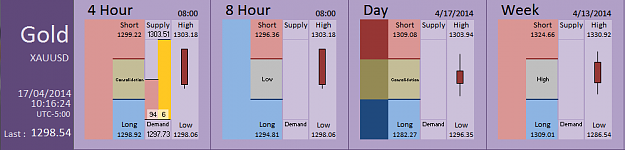
Using the FIA, traders need only "Sell the Highs" & "Buy the Lows".
- #108
- Apr 15, 2014 8:18am Apr 15, 2014 8:18am
- | Commercial User | Joined Feb 2014 | 1,077 Posts
Using the FIA, traders need only "Sell the Highs" & "Buy the Lows".
- #109
- Apr 15, 2014 3:31pm Apr 15, 2014 3:31pm
- | Commercial User | Joined Feb 2014 | 1,077 Posts
Using the FIA, traders need only "Sell the Highs" & "Buy the Lows".
- #110
- Edited 12:16pm Apr 16, 2014 2:49am | Edited 12:16pm
- | Commercial User | Joined Feb 2014 | 1,077 Posts
Using the FIA, traders need only "Sell the Highs" & "Buy the Lows".
- #112
- Edited 1:02pm Apr 16, 2014 6:27am | Edited 1:02pm
- | Commercial User | Joined Feb 2014 | 1,077 Posts
Using the FIA, traders need only "Sell the Highs" & "Buy the Lows".
- #114
- Apr 16, 2014 6:35am Apr 16, 2014 6:35am
- | Commercial User | Joined Feb 2014 | 1,077 Posts
Using the FIA, traders need only "Sell the Highs" & "Buy the Lows".
- #117
- Apr 16, 2014 6:46am Apr 16, 2014 6:46am
- | Commercial User | Joined Feb 2014 | 1,077 Posts
Using the FIA, traders need only "Sell the Highs" & "Buy the Lows".
- #119
- Edited 9:24am Apr 17, 2014 5:13am | Edited 9:24am
- | Commercial User | Joined Feb 2014 | 1,077 Posts
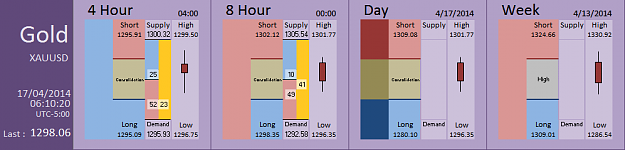
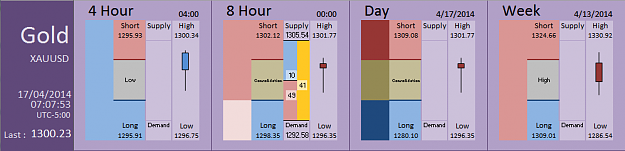
Using the FIA, traders need only "Sell the Highs" & "Buy the Lows".