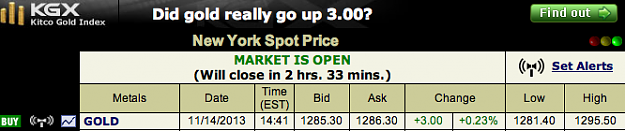
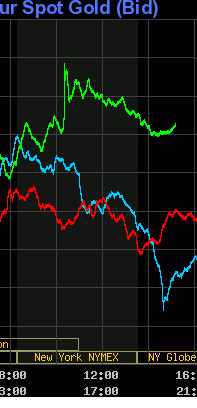
DislikedIf it wants to break 1295 it will probably make a pullback to 1279-1282 to fake everybody. {image}Ignored
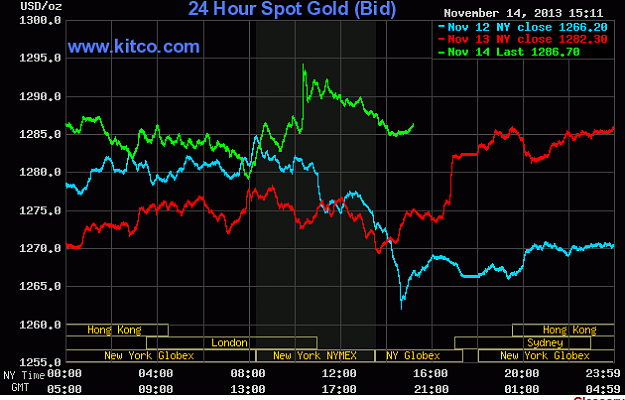
If you look at this simple 3 day line chart - we can see the today's high as well as the prior low and then the area of "price congestion" if you will,
which is right around 1280-85.
Sometimes it is interesting to use multiple days of line chart price action to see where potential support/resistance and congestion or sideways movement is located.
Here we can look for pullback failures for shorts, resistance breakouts for longs, as well as where the price may just fizzle out for the weekly close or
remain is slower markets..
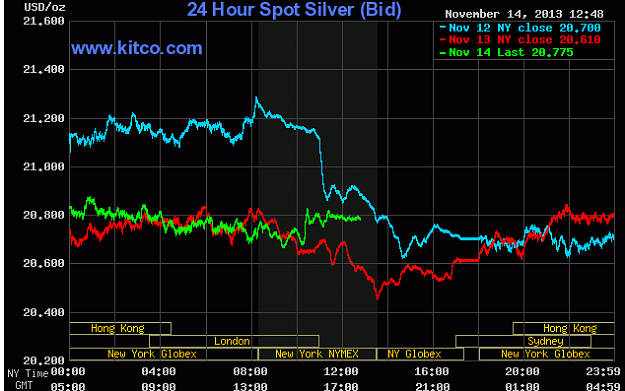
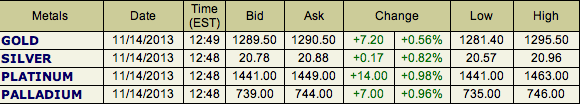
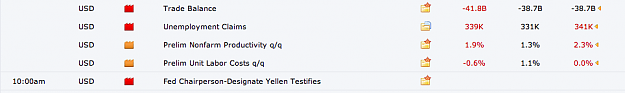
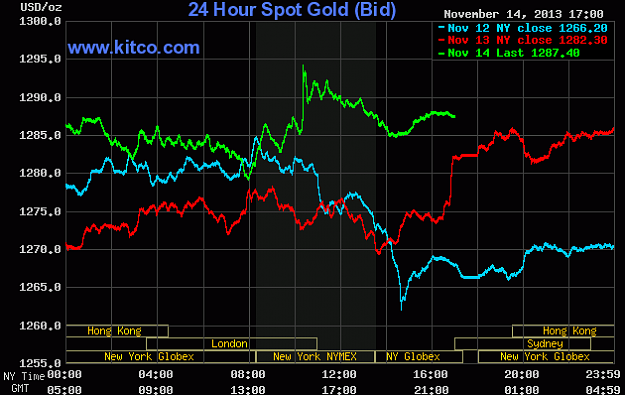
Here is a shot from about a minute ago.
Attached Image (click to enlarge)
XAU-XAG/USD_Gold n Silver Trader's Thread = Technicals, Fundamentals & News