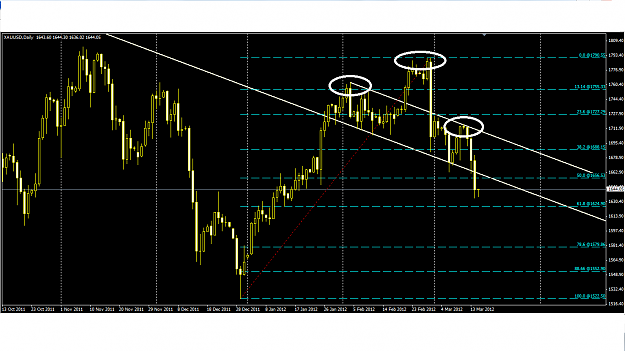
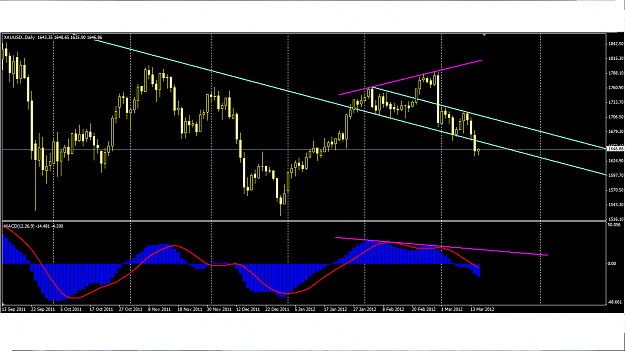
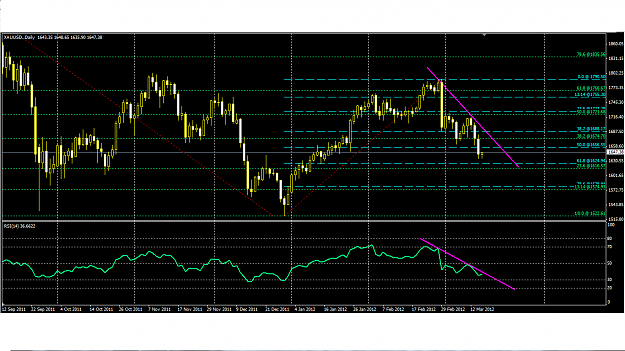
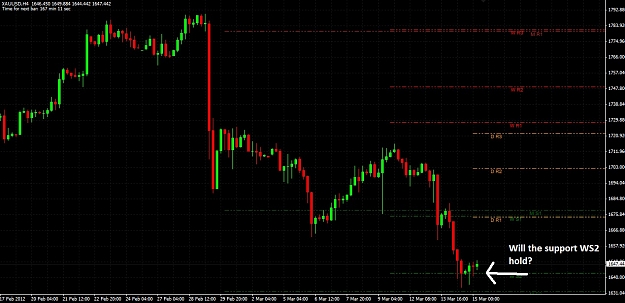
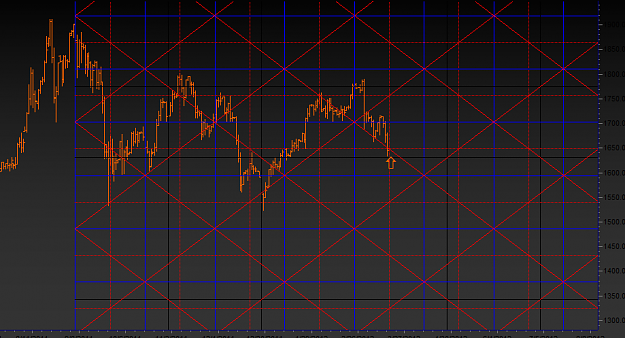
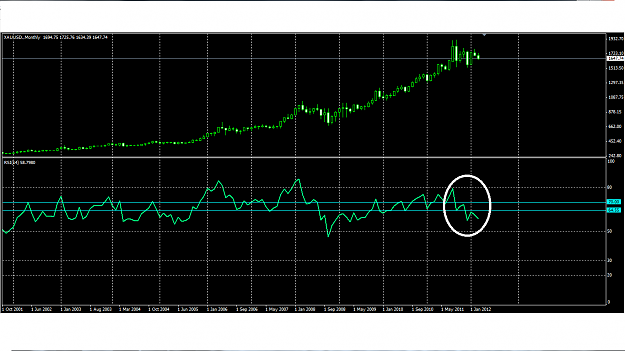
I ain't sure how far this consideration can be correct. If H& S, then price would drop further. May be a fall after re-testing the falling neck level where 50% of the FIB also lies. So watch 1650 to 1660 area with caution.
FXT
FXT
GoldenEuro Cross (XAU/EUR) GoldenAussi Cross (XAU/AUD) 51 replies
Gold futures & XAU 77 replies
Daytrade - XAU/USD & XAG/USD 14 replies
XAU/JPY & XAG/JPY 13 replies
Successful XAU/USD traders 7 replies
Disliked
I do read up on the U.S current account released yesterday, of course, it is in deficit, worse than forecast and has become a much of a NORM. I was thinking why it has not impact gold much.Ignored
DislikedIn my opinion
current account positive = more demand for the currency in the sense of export/import
so negative = less demand for currency and it should lower the price based on economic theory
however, in this kind of economic condition (in the europe especially), the USD is thought as a safe haven. So there will also be increase in demand for USD not for export/import purpose but as a mean of money storage.
As we all know, the market is sometimes if not always driven by fear/psychological effect. Thus "everyone" should neglect the...Ignored
Dislikedyes, sure!
wave (e) is a contrating triangle with reverse alternation (a>c>e, d>b) shown on chart 1.
I'm not entirely convinced that:
1. wave (d) is completed. However the drop is violent and price respected the fibo ret. levels of (c)-wave which is a must for (e)-wave. The anticipated scenario is "gold count 1". The lowest possible extremum for wave (e) is 1588, the most probable - 1638
2. wave (e) is short in time and price and 1662 is not it's low. Assuming all the requirements mentioned here http://www.forexfactory.com/showthre...46#post5454946...Ignored
QuoteDislikedWilder also considered failure swings as strong indications of an impending reversal. Failure swings are independent of price action. In other words, failure swings focus solely on RSI for signals and ignore the concept of divergences ... A bearish failure swing forms when RSI moves above 70, pulls back, bounces, fails to exceed 70 and then breaks its prior low. It is basically a move to overbought levels and then a lower high below overbought levels.
http://stockcharts.com/school/doku.p...ool:technical_ indicators:relative_strength_index_ rsi
DislikedI am looking now at the support WS2 whether it will hold or not. After this level has been confirmed or broken I will trade it.Ignored
Dislikedi think Beeb the downfork didnt really cap the recent drive upwards and not reactive towards that particaular fork - i believe it is reactive based on ur chart to the up-fork as the ML caught the high pretty well, and it might react similarly on the lower line.
im no pitchfork master but thats what i think from ur chart
btw have a nice safe trip!Ignored
DislikedWhat do you think could be the worst scenario, based in daily macd divergence and this rsi bearish failure swing?Ignored