That sucks. How did you lose on it? Or what happened?
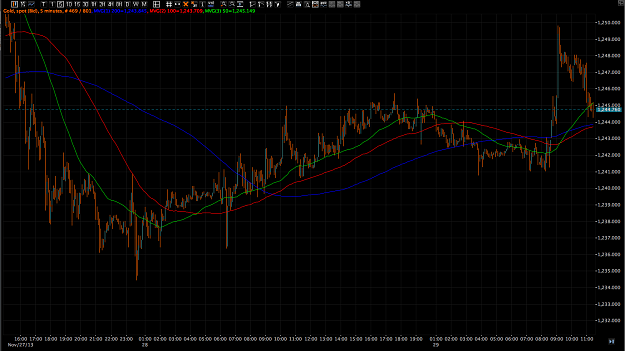
Also the last chart has the date of the 29th which I have the same PA - say 41 to 1249/50
The discrepancy chart from GoMarkets seems like it is on the 28th but maybe the chart just needs to be bigger / blown up on Mt4 like the one above.
On the 28th the price never did go from even 1235 to 1249 in a few 5 min bars. It was in the High 34s in the start and I have a high around 1245 for the day.
So it seems thier info DEFINITELY has flaws.
If this is the move from the 29th then it still is flawed as the low is in 1240 and the high 1250. Bid
DislikedXtrade, That was a real trade not demo. Approx. : Toward North = 700pips and South = 1350pips. Attached is from another brokers :VantageFX {image}Ignored
Attached Image (click to enlarge)
XAU-XAG/USD_Gold n Silver Trader's Thread = Technicals, Fundamentals & News