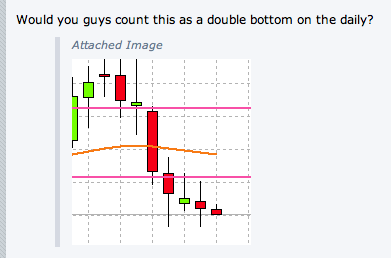
DislikedFrom that little snip - no - if you had another snip next to it where the price went up and then back down to the same area - didn't break the support and continued past the old highs (like the one in theory on the second "snip") then yes. {quote}Ignored
I'm assuming you are reffering to the last two bars? I mean, I suppose if you had two almost identical daily bars bottoming at the same price with decent PA
(not just a small candle with two short wicks) with say a first bunch of the price declining to the bottom "two" then the fourth bar reverses takes out the "two's" highs if different and continues north It "MIGHT" be a double bottom,
But, usually it is spaced out a bit in an attempt to make two separate attempts south of a price support, the first pushes the support or tests the level for strength,
the second is usually another attempt by the bears to break through and now test the area for validity, then if it does not break, it is valid and decently strong to be on the daily. Here, shorts may then cover and buyers renew on the signal, in turn pushing the price up resulting in the reversal wanted after a double bottom.
After just two consecutive days, it is a bit too short of a time period to know if the price has really "bottomed" or is just in range.
Whereas if it is over a week or two, the chances are greatly increased.
But on your chart I don't even see the other scenario, which the more I think about it, is not very reliable. - We just had that two consecutive bar low pattern last week and the price went lower.
Attached Image
XAU-XAG/USD_Gold n Silver Trader's Thread = Technicals, Fundamentals & News