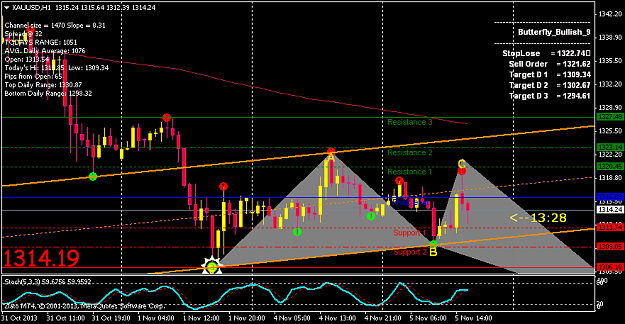
Disliked{quote} Hi KiwiOz, thanks for the reply, I don't exactly understand what you mean with your daily pivot on any chart timeframe? Then what indicator do you use that draw out those cyan lines on your chart? Do they project the levels? Don't worry, I worked it out, do you use this for intra day scraping like we use fib levels? I see it is above its pivot point at this stage, having some support at the pivot point? Do we wait for it to cross it to look for S1?Ignored
Money Makes Money