I was debating whether I should post this chart, since it is essentially the same as Ramses's count. But I figure the analysis may be useful anyway. The different colour labels are explained below:
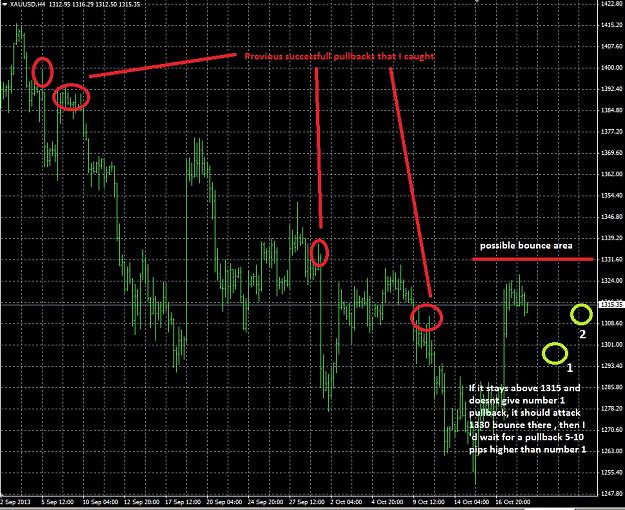
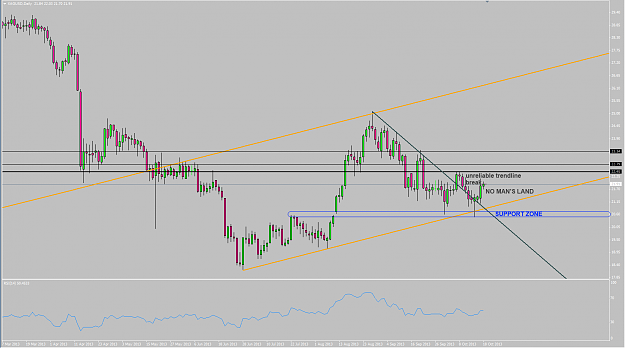
From my prefered count (white and grey labels) I anticipate one more wave up which would be wave 5. This would hit the monthly pivot at 1,345, touch the rising TL as well as put the necessary diversion in MACD and RSI for a reversal. However, before the 5th wave can happen, RSI and Stochastics on all TFs below H1 indicate a wave 4 down. The obvious target would be 1,305 - the end of the previous 4th wave of one lesser degree. That is also in the vicinity of the upper TL drawn along the LHs of the decline, as well as the 50% Fib of the current wave up. Once wave 4 down has printed we can expect a 5th wave up - extended beyond 1,345 or not.
In red, an alternate count which sees continuation of the downdraft since August. These paths for PA are plausible but improbable IMO, since a glance at PA as it behaves toward the lower TL of the decline shows the strong buy demand at those levels. The zigzagging nature of PA and the many triangles (and repeated failed H&S setups) in this decline are my reasons for believing it was a downward correction. Nonetheless, the red count is shown until proven invalid. The blue label D shows immediate downside since the RSI and Stochastic diversion indicates an imminent reversal - again, I would be surprised to see PA head back below 1,305.
http://ubuntuone.com/3Z9ObpP9mpH6EgGINMnoHf
cryptocurrency everytime