Could be or could be wishful thinking. Thinking tapering coming in Sept will bring dollar strength. How long and how much is anyone's guess. As always IMO price is most important though - not fundies.
Ignored
Price often moves due to fundies. Even if the dollar strengthens it does not necessarily mean gold will fall.
XAU-XAG/USD_Gold n Silver Trader's Thread = Technicals, Fundamentals & News
{quote} It's conceivable it could push up to 1550 (anything is possibly) especially when one looks at your third chart, which shows the magnitude of the drop, but I see a 50% fib at just under 1500. Furthermore the 38% fib this last week proved too much.
Ignored
I gave you the levels,
If you pull a retracement fib from 1921 "all time high appx"
down to 1181 "the multi year low"
50 % is 1550
It's in the other charts as well.
Try looking at a 10 year chart and tell me if that is inconceivable,
not even close to being.
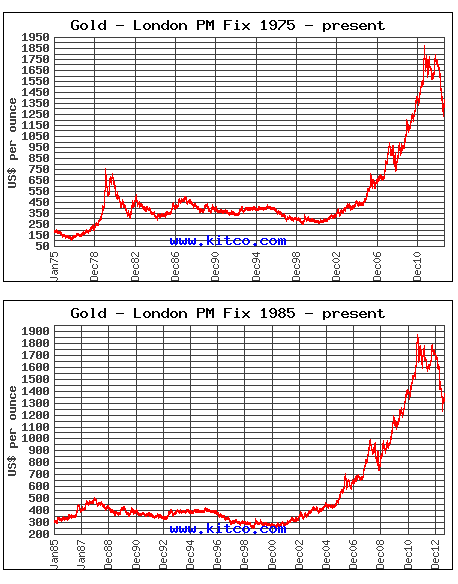
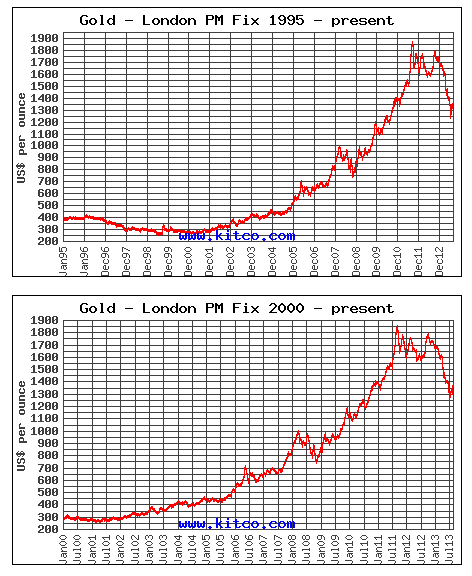
More interesting look at these longer term charts:
The recent correction is almost the SPITTING IMAGE of what happened to price in / around 1980...
Next you will likely think, SHIT, Why didn't I buy gold for 450 in 2005!!!! 2005! THE Price has almost quadrupled since then,
next Yes! We were due a correction.
Even if we hit a lower tl in case the correction is not over. I don't see anything past ++1050.
Attached Images
XAU-XAG/USD_Gold n Silver Trader's Thread = Technicals, Fundamentals & News
{quote} i was talking gold but the concept is the same the whole point of technical analysis is to eliminate risk. therefore if you don't have a view or a set up why get in now given the factors i mentioned? the correct trade was to be in silver from the low 19s
Ignored
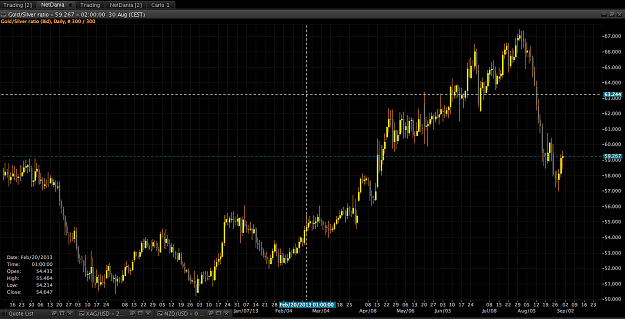
You guys can follow the GSR to see which metal is stronger. Gold Silver Ratio.
How many Troy Ounces of Silver it takes to get ONE Troy OZ. of GOLD.
And i have said MANY a time this is a great way to begin trading physical Metals.
It takes patience!
But helps you learn two sides of the market in one.
The charting, planning and trigger pulling and the
execution, actually buying the silver or gold.
Things to consider:
Is mail order faster?
Free shipping?
Tax?
Spread?
How much GAS or Money do I need to travel to the store.
Which metals are easiest to RE- SELL!
Will I spend the cash if I have it in Hand?
Just a few.
Attached Image (click to enlarge)
XAU-XAG/USD_Gold n Silver Trader's Thread = Technicals, Fundamentals & News
{quote} Hey Brother, Those are spot line charts using the historical Lodon fix for whatever day, Are you looking at it in the chart itsef? Or a specific chart?
Ignored
I mean historical price you showed , compared with extraction expences of the metal. Excuse my poor english.
{quote} I gave you the levels, If you pull a retracement fib from 1921 "all time high appx" down to 1181 "the multi year low" 50 % is 1550 It's in the other charts as well. Try looking at a 10 year chart and tell me if that is inconceivable, not even close to being. More interesting look at these longer term charts: The recent correction is almost the SPITTING IMAGE of what happened to price in / around 1980... Next you will likely think, SHIT, Why didn't I buy gold for 450 in 2005!!!! 2005! THE Price has almost quadrupled since then, next Yes!...
Ignored
You're positioning your fibs using a different swing to me. Not much more to it than that. It shouldn't bother you that we choose to place them differently.
But placing such emphasis on one thing (a fib retracement) is dangerous in my humble opinion.
I have no idea (and actually, very little interest, at least for the next few months) whether 1050 even will be visited let alone broken.
You seem to be bullish - are you?
Good luck.
{quote} Hey Brother, Those are spot line charts using the historical Lodon fix for whatever day, Are you looking at it in the chart itsef? Or a specific chart?
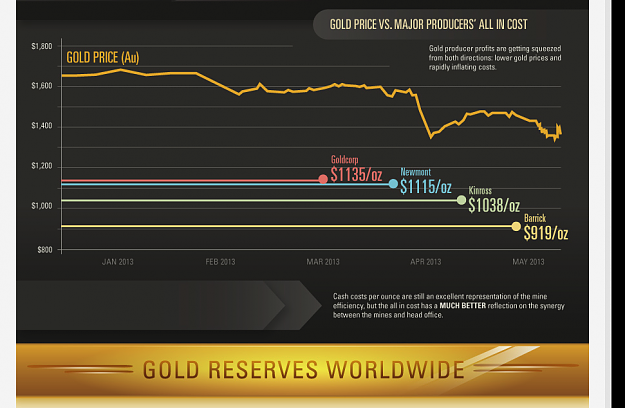
I'm not sure if it's what is desired but there have been various articles on SeekingAlpha attempting to quantify the "all-in" extraction cost of gold, with varying results.
One of the criticisms of any such attempt is that miners supposedly become less efficient as the price of gold goes up, and are forced to become more efficient as the price of gold goes down, so any conclusions drawn at any particular time from a set of static figures are liable to be unusable as an input to any kind of methodology that attempts to calculate the "fair", "true" or "floor" price of gold.
{quote} You're positioning your fibs using a different swing to me. ---- You seem to be bullish - are you? Good luck.
Ignored
I don't rely on fibs I use them to reinforce S/R I have already made myself, and for day / swing trading because every one uses them meaning large traders,
small, banks, hedges, etc. Even if they say they don't they are aware of major levels. Usually you will not see them on my charts.
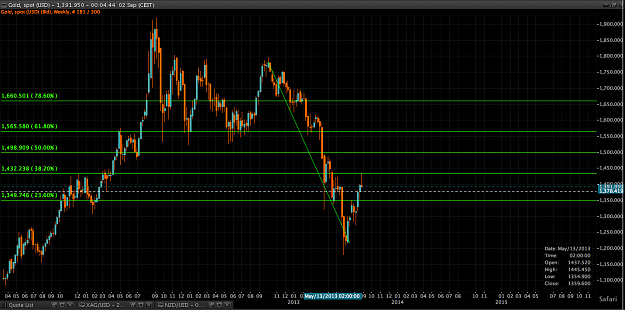
Yet, I am trying to look at major levels and now we have a spread from 1920 appx Reaction High
to 1180 a 740 USD per OZ difference. Normally I would have pulled it from
The last full swing. So High appx 1780 No wicks to 1215 No Wicks
Here is the chart. And I still get 1565 or so at the 61.8 up one notch from 50%
There is clear support and resistance plotted here anyway fibs or no fibs.
Too many bullish factors to ignore, my bias will remain so until I begin to see real weakness again.
I will say though, it is Just September and there are a lot of hurdles to overcome.
Yet, I don't want the price to move too far too fast, HAD, we kept going up past 1920 it would have started to just be a straight line up on the charts,
which is not healthy in any market.
IMO
XT-
Attached Image (click to enlarge)
XAU-XAG/USD_Gold n Silver Trader's Thread = Technicals, Fundamentals & News
I'm not sure if it's what is desired but there have been various articles on SeekingAlpha attempting to quantify the "all-in" extraction cost of gold, with varying results. One of the criticisms of any such attempt is that miners supposedly become less efficient as the price of gold goes up, and are forced to become more efficient as the price of gold goes down, so any conclusions drawn at any particular time from a set of static figures are liable to be unusable as an input to any kind of methodology that attempts to calculate the "fair", "true"...
{quote} I don't rely on fibs I use them to reinforce S/R I have already made myself, and for day / swing trading because every one uses them meaning large traders, small, banks, hedges, etc. Even if they say they don't they are aware of major levels. Usually you will not see them on my charts. Yet, I am trying to look at major levels and now we have a spread from 1920 appx Reaction High to 1180 a 740 USD per OZ difference. Normally I would have pulled it from The last full swing. So High appx 1780 No wicks to 1215 No Wicks Here is the chart. And...
Ignored
Yes, that's a swing that I pulled a fib grid over earlier; but I was eyeing a 50% retracement whereas you seem to be eyeing a 62%. It's a toss-up if it will even get past 38% (at least for me, right now) but if it does, I'd be looking at 50% as a possible target; beyond that I'd have to deal with at the time. Frankly, that could be months away.
It's hard enough predicting where gold will be for the next few days, let alone the next few months. I think that's impossible. But it doesn't stop people from trying
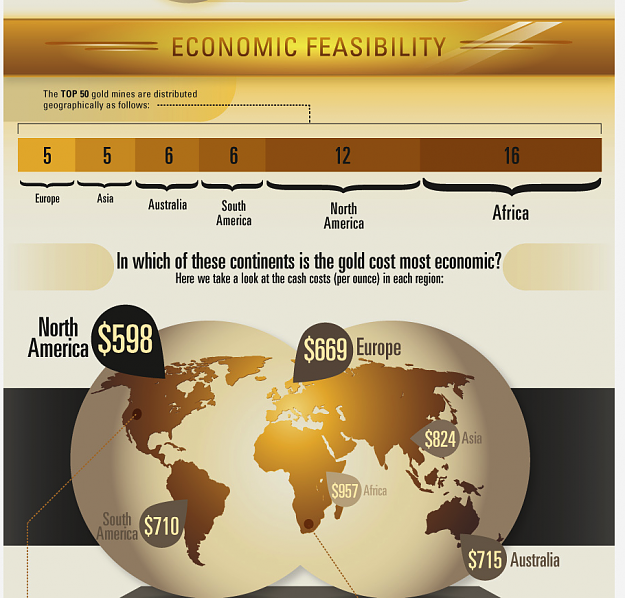
{quote} Take a look at what I am posting here and the link to go with it. It varies from mining area to mining area, mine to mine, and country to country all with one WORLD PRICE!!! So that will be a hard chart to make. {image} {image}
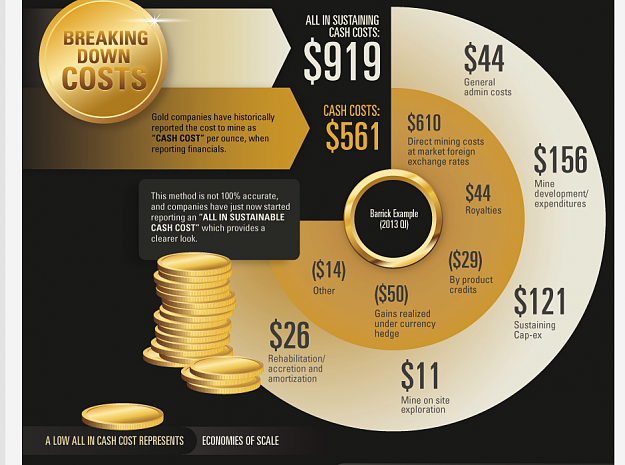
This one puts things into perspective "hopefully" for those that don't realize what the price they click buy and sell on really follows.
This is for ONE OZT .999 / .995 I believe is COMEX deliverable depending on the assayer/mint.
Attached Image (click to enlarge)
XAU-XAG/USD_Gold n Silver Trader's Thread = Technicals, Fundamentals & News