Break of tl, retest and than further down? That's the theory, right?
Ignored
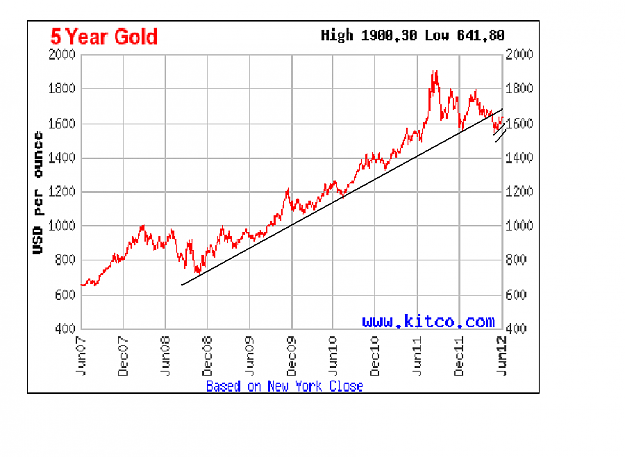
Let the chart tell you what is going to happen - if the line is breached and (importantly) then becomes support prices should rise further. I don't have targets or make prognostications, I just have expectations of where price may find support or resistance and play along with that......
beeb
EDIT - As I have mentioned before it isn't the breaching of a line of resistance that I find important (that could just be a flush) it is where support then comes in. Likewise when support is breached, what I watch for is where resistance then emerges......
Let the chart tell you what is going to happen - if the line is breached and (importantly) then becomes support prices should rise further. I don't have targets or make prognostications, I just have expectations of where price may find support or resistance and play along with that......
beeb
EDIT - As I have mentioned before it isn't the breaching of a line of resistance that I find important (that could just be a flush) it is where support then comes in. Likewise when support is breached, what I watch for is where resistance...
Ignored
Thanks, Beeb!
I mainly trade the 1 minute pitchforks - very useful!
Any advice you have is much appreciated.
Bedtime for me soon. have to get up before 6 am to see Paul Coghlan's webinar. Thanks for keeping us all in the loop, much appreciated.
Whats a good place to upload photos that keep good resolution? Also I will work on in the next week to better tell how it works. I will work on making it simple and nicly put together. I need to do that for myself too!
Ignored
What I do is saving the charts as images. Usually as png. which is a light format.
Then when yoou are replying to thread, attach them using the button Manage Attachments in the section Thread Options.
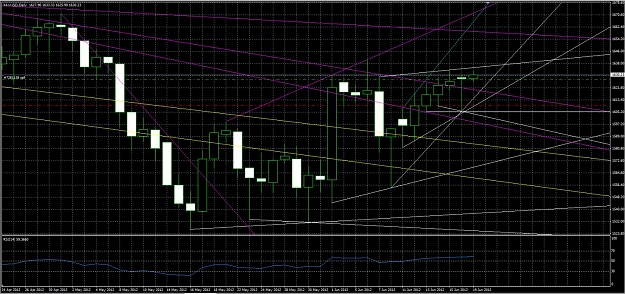
since time is taking longer for the down action and a new 4hr stick has appeared this morning I am not looking for a hit around 1623 area not 1621. As time moves forward without hitting targets so does the original target. Once again I'm not talking in certainty, this is just how I trade. Also, for me if it breaks well below 1622 then I have to rethink the possibility of 1660-1670 even being a possibility. Its showing great upside, but that upside momentum can be taken away in one move. Waiting before I commit completly to up side, but I'm ready!!
This is just me, but I'm looking for a return to the 1621 area, then I will see what happens there, then I'm playing long, well to the 1660 to 1670 area, as I watch what happens there. Though if it breaks through there will still be at least a 50% trace back and if it touches and stays in that area I'm looking for targets further down. I will take profit at each level to make sure it breaks each one since anything can happen, I just play one medium term target at a time.
Ok, this is how it goes for me normally, I keep changing my views as I keep seeing more things, since my strategy is very complicated for myself, it normally takes a week or so to figure it out, and now i feel like I'm 85% there instead of 65%.
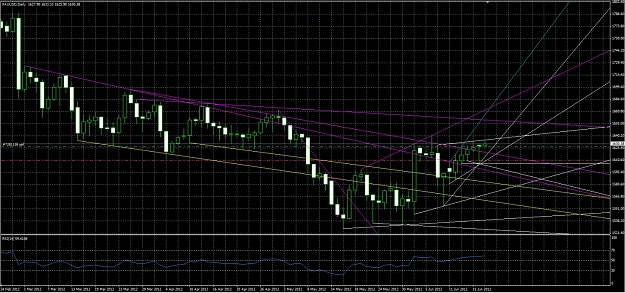
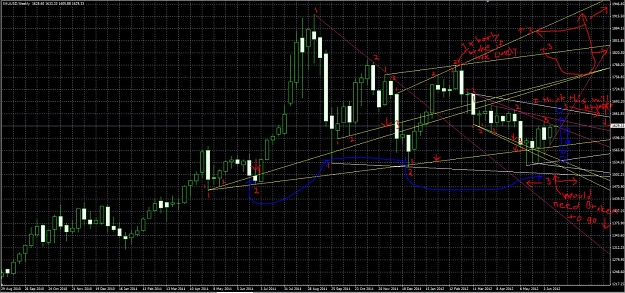
I'm starting to think that 1670 area is not a target as of now. That will be later and to many things will change if thats going to happen now. I back to my original plan of down side, the arch is forming to perfectly for me. I see maybe a last price action of 1635 at max, anything beyond that for me will have me worried. I will post chart trying to show something!! Once again this is just me, I am talking this out with myself and sharing at the same time.
Ok, this is how it goes for me normally, I keep changing my views as I keep seeing more things, since my strategy is very complicated for myself, it normally takes a week or so to figure it out, and now i feel like I'm 85% there instead of 65%.
I'm starting to think that 1670 area is not a target as of now. That will be later and to many things will change if thats going to happen now. I back to my original plan of down side, the arch is forming to perfectly for me. I see maybe a last price action of 1635 at max, anything beyond that for me...
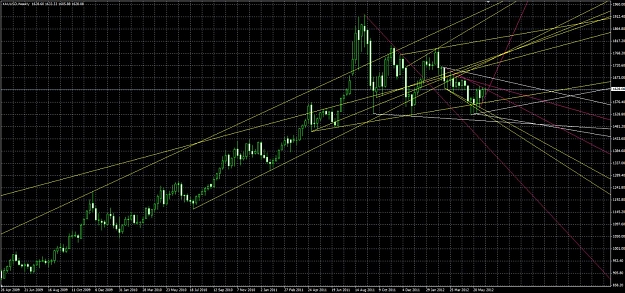
They are only on a 4hr time frame which is very short term really.. I'm posting some charts now form my last post and I'm done posting for today! Need to take a break from it..