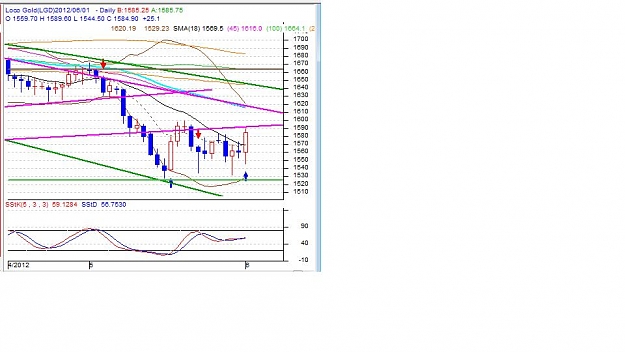
Here is a chart of daily XAU.
the Black line is the 18dma.
see how it works - see when the market is below, it runs up to it and fails on several days. when the market closes above the 18dma, i look for the long side. So the 18dma forms a pivot to me. PA below - look for shorts. PA above look for long opportunities.
I also find that often on the second or third day, PA winds back to test the 18 dma. and if it holds, goes up again.
18dma is but one indicator to me.
DislikedYa lost me.
June is the front month right now which is key. I know you are not saying that April is but why even focus on it then?
Vol on Fri
April 220
May 473
June 127900
I'm trying to understand but I've heard reasons why this and that length of MA of whatever variety of used, other than the self-reinforcing argument that is given by most, that a randomly generated line would do as well.
But I'm not trying to give you a hard time if it works, just like to understand why you feel it does.Ignored
Attached Image (click to enlarge)
I have no enemy; I make Incautiousness my Enemy.