So finally I didn't keep that trade. (Buy @ 1773 TP 1789 SL 1769)
I could get some 5$,
But that triangle and candlestick formation made me change my mind.
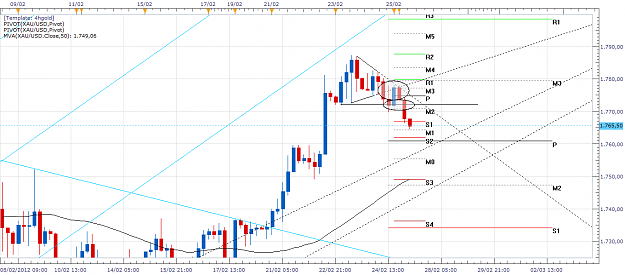
Now a descending triangle visible in H4. Target @1756. I'd say 1760.
I'll wait and see.
Ignored
This is what I was talking about.
I really don't expect anyone to tell me where to buy or to sell.
I'm just expecting to be aware of possible outcomes.
As I told you before, I had an entry order to buy @ 1773, and I deleted it because PA was telling me something different.
Two triangles, first one was broken and retested, price came inside the triange so I expected higher prices. Gold use to fake. Nop. Price went down again. The second triangle was broken and price was up again. That's why I told I don't like fridays afternoons. No confirmation, no nothing.
Also H&S was visible.
When I asked for a price for an entry it was not a request for a crystal ball, but for a technical approach.
As you've done with S&H or with flags, for example.
When I called for a target @1756-60, I did it based in this:
1. Trend: In order to qualify as a continuation pattern, an established trend should exist. However, because the descending triangle is definitely a bearish pattern, the length and duration of the current trend is not as important. The robustness of the formation is paramount.
2. Lower Horizontal Line: At least 2 reaction lows are required to form the lower horizontal line. The lows do not have to be exact, but should be within reasonable proximity of each other. There should be some distance separating the lows and a reaction high between them.
3. Upper Descending Trend Line: At least two reaction highs are required to form the upper descending trend line. These reaction highs should be successively lower and there should be some distance between the highs. If a more recent reaction high is equal to or greater than the previous reaction high, then the descending triangle is not valid.
4. Duration: The length of the pattern can range from a few weeks to many months, with the average pattern lasting from 1-3 months.
5. Volume: As the pattern develops, volume usually contracts. When the downside break occurs, there would ideally be an expansion of volume for confirmation. While volume confirmation is preferred, it is not always necessary.
6. Return to Breakout: A basic tenet of technical analysis is that broken support turns into resistance and visa versa. When the horizontal support line of the descending triangle is broken, it turns into resistance. Sometimes there will be a return to this newfound resistance level before the down move begins in earnest.
7. Target: Once the breakout has occurred, the price projection is found by measuring the widest distance of the pattern and subtracting it from the resistance breakout.
I know the article talks a about duration in terms of many weeks to month, but as it is H4, many bars, would be fine. I think.
Price bounced very close to first triangle apex. The reason I didn't go short is because of fundamentals, as I expect price to go north.
So what I'm trying to do is to build a mindset.
Now another question, a tecnhical one. Let's say price goes lower. At which level can you say there is technical damage tha opens a door for further downwards move?
Please, answer this even if the price goes higher. I just want to know how do you become aware of a possible shift in price direction once price has gone the other way expected.
I really don't expect anyone to tell me where to buy or to sell.
I'm just expecting to be aware of possible outcomes.
As I told you before, I had an entry order to buy @ 1773, and I deleted it because PA was telling me something different.
Two triangles, first one was broken and retested, price came inside the triange so I expected higher prices. Gold use to fake. Nop. Price went down again. The second triangle was broken and price was up again. That's why I told I don't like fridays afternoons. No...
Ignored
XAU-XAG/USD_Gold n Silver Trader's Thread = Technicals, Fundamentals & News
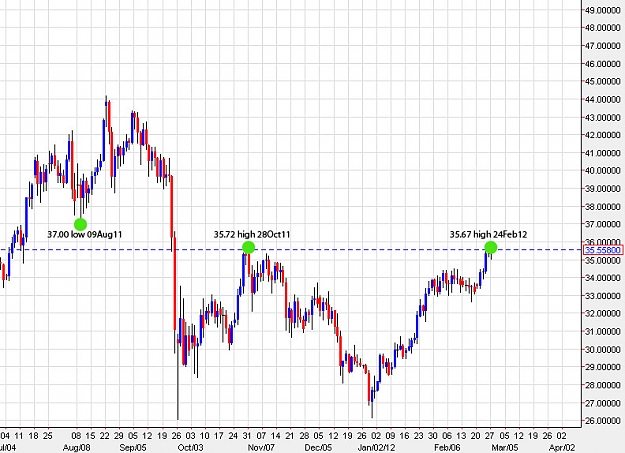
If silver properly clears this 35.67 (high of 28Oct11) and 35.72 (high of 24Feb1
2) level, I see little resistance until the 37.00 region (low of 09Aug11).
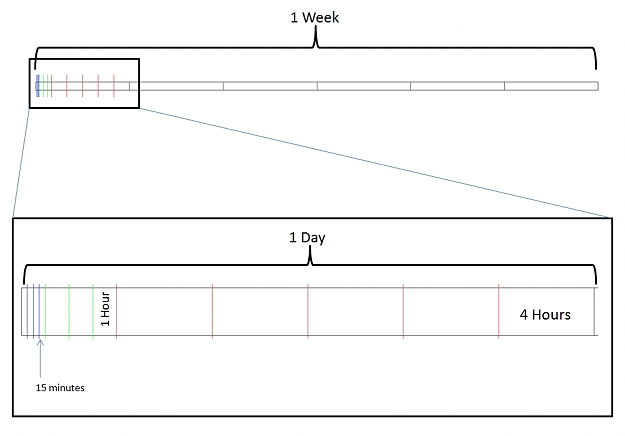
This is not directed at any one in particular - I see a lot of people in here looking at lower timeframes and Xtrade is consistently preaching the values of looking at higher timeframes. From a statistical point of view, you have to realize that more data is more reliable... that just makes sense right? So why do people try to determine whether or not trends have reversed or not after 1 or 2 hours of lower prices. I have created an image which shows the difference in size that the timeframes are in relation to each other. The weekly has 576x more data than a M15 chart and the daily has 96x more data than a M15 chart. If I take a trade, I am going to trade in the direction that has 96x to 576x more likely a chance to win.
Joined Aug 2009
|
Status: Patience = Simplest of all skills
|7,152 Posts
Trading is not an OVERNIGHT crash course to success.
You HAVE TO DO THE TIME
If people could pay for success then every noob that started a demo would lose 50,000 USD before being successful.
The main point of this thread has always been to share ideas and analysis with others. I don't post anything I don't stand behind, have looked at and I am ready to back up or have done so, within one sentance of the Question - Why?
You have come to the right place, yet do the TIME if you are interested.
GOLD itself is a fascinating metal to learn about.
People lately have been coming around asking and almost Expecting someone (if not me) here to give them the "holy grail" or ticket to easy street.
There is NONE, and IF there was I would be charging.
I feel confident in what I do and this is a major part of trading, Part of me likes to give something back to the forum, which I learned tons about currencies on.
Yet, there still is NO EASY WAY without, dedication, responsibility, trial and error, reading, experience, etc.
Joined Aug 2009
|
Status: Patience = Simplest of all skills
|7,152 Posts
This is a great post and thank you for writing.
To each is own, yet noobies should not be trading an M15 spot Gold chart, once the market really get's cooking and we have 50 USD swings and 100 USD potential days, many will learn the hard way.
It is easy to lose 100 Profitable scalps in less than 10 minutes, if things are not properly set up.
Just trying to show people the answers to the broad questions.
Yet, every time I post something in depth with accurate forecasts and targets, it seems someone is coming back with one of the 3.
1. Where do I short?
2. Where is the price going?
3. This pattern has occured on the 5 minute chart a Reversal is coming big!
If I had a dollar for every reversal called and then the price moves 300 USD up..........
It is getting a bit redundant, and I will encourage all noobies to read and think about what they write BEFORE posting.
Many of the experienced traders here are happy to share their views, but don't ask if you won't listen. AND believe me, it is OBVIOUS when someone shows true interest, or just wants an "easy street ticket.
This is not directed at any one in particular - I see a lot of people in here looking at lower timeframes and Xtrade is consistently preaching the values of looking at higher timeframes. From a statistical point of view, you have to realize that more data is more reliable... that just makes sense right? So why do people try to determine whether or not trends have reversed or not after 1 or 2 hours of lower prices. I have created an image which shows the difference in size that the timeframes are in relation to each other. The weekly has 576x...
Ignored
XAU-XAG/USD_Gold n Silver Trader's Thread = Technicals, Fundamentals & News
Joined Aug 2009
|
Status: Patience = Simplest of all skills
|7,152 Posts
That is not really a Head and shoulders, more a Range,
There are no major Trend lines broken.
Now that you know this, would you take the same trade???
How are you even ENTERING A TRade without a LOOSE Target.
To me this seems poorly thought out, you are looking for patterns that are not there.
This trade is invalid.
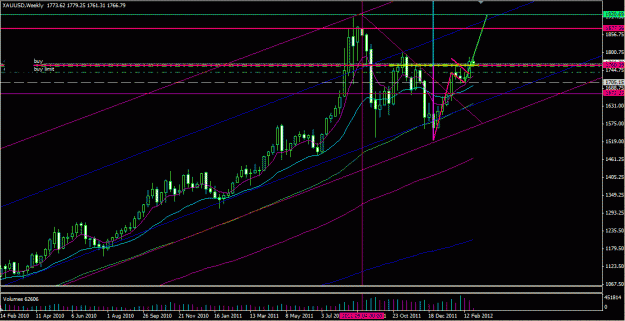
Here is the weekly chart with all the patterns I mentioned and the MAJOR working Trend lines.
Still see the same thing???
Rest assured any trend line drawn on a lower term chart WILL BE BROKEN.
You want to look at what everyone ELSE SEES, and where the big money is going to buy and sell to get better trades. Otherwise you are pissing in the ocean and will get swallowed up eventually.
See how all the trend lines relate to the patterns and targets and other trend lines relate to the moving averages????
This is fluid not FORCED.
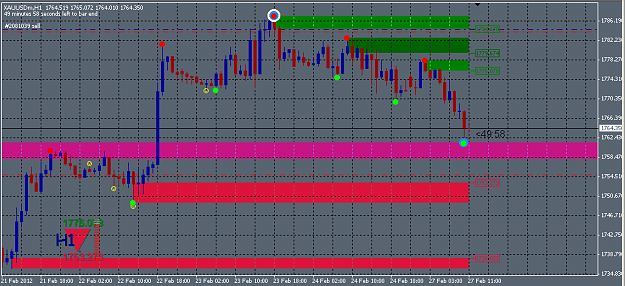
Hi everyone, I've taken a short from 1773.35 based on H&S and break of trend line. I don't have a particular target, I will just try to scalp as many pips as price will give me. Chart H1
Ignored
Attached Image (click to enlarge)
XAU-XAG/USD_Gold n Silver Trader's Thread = Technicals, Fundamentals & News
Dear-XTrade
Through my reading of your posts Value noticed you are on the experience and expertise sufficient in yellow metal - gold - and most of the traders here are people who are novices and I am one of them I wish to be your posts in a language understood by more so that we can analyze and I'm here I'm talking about myself, I hope you help to gain for me and my family through as this work is said to benefit from Giralnas --- people --- and here we talk about why a big cake for thee
thank you so mu......
Ignored
May I suggest that if English is not your first language and you want to be understood, that you use very short sentences (even this one is too long).
I just bought at 1768, in the 4h timeframe, 30 SMA seems to hold, last swing down in the 1h timeframe showed nice support.Waiting for a new swing to the upside later in the day over 1800.
Trading is not an OVERNIGHT crash course to success.
You HAVE TO DO THE TIME
If people could pay for success then every noob that started a demo would lose 50,000 USD before being successful.
The main point of this thread has always been to share ideas and analysis with others. I don't post anything I don't stand behind, have looked at and I am ready to back up or have done so, within one sentance of the Question - Why?
You have come to the right place, yet do the TIME if you are interested.
nobody can predict as crystalballs break.
itnterday, no your days range as a general rule along with s/r of your timeframes as they may line up with each other.
gold up from fri. close and found support at weekly pivot 1730 area breaking weekly highs 1762 area, if you buy at 1778 mm will permit 1760, and mm will permit a rescue at 1730-38 area.
mind your mm.
weekly chart
1798
1738
1716
Ignored
mon. retest of last weeks breakout 1762 area noted.
tue bias is up from 1760-62 area.
tue. daily
1789
1761
1733
lets see if 2 day countertrend is sufficient, otherwise with 3 day counter trend will be watching 1730-38 response.
jsr,
after she reached 1760-62 area, hope you took note of candle formations and cut that long at your 1778 area once she was back up in the area again.
I just bought at 1768, in the 4h timeframe, 30 SMA seems to hold, last swing down in the 1h timeframe showed nice support.Waiting for a new swing to the upside later in the day over 1800.
Ignored
Patience is the key, you may or may not get the result the same day
I just bought at 1768, in the 4h timeframe, 30 SMA seems to hold, last swing down in the 1h timeframe showed nice support.Waiting for a new swing to the upside later in the day over 1800.
Ignored
I'm with you. long @ 1767 and 1773 from yesterday, stop is 1758. tgt = 1803
wave 4 correction could be over at 1761, and we're now in wave 5 higher.
Historical charts can be found here http://www.kitco.com/charts/
"
On March 17, 1968, economic circumstances caused the collapse of the gold pool, and a two-tiered pricing scheme was established whereby gold was still used to settle international accounts at the old $35.00 per troy ounce ($1.13/g) but the price of gold on the private market was allowed to fluctuate; this two-tiered pricing system was abandoned in 1975 when the price of gold was left to find its...
Ignored
interesting. i never knew gold rallied that much in those days. X would u happen to know a monthly chart that can be chartable with that kind of long term data?