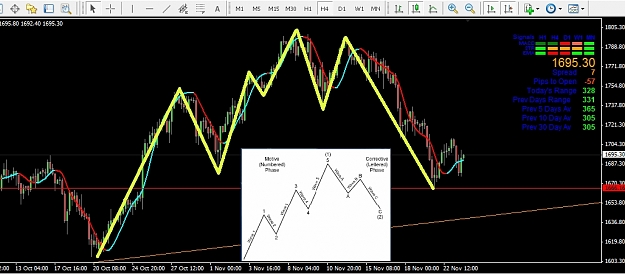
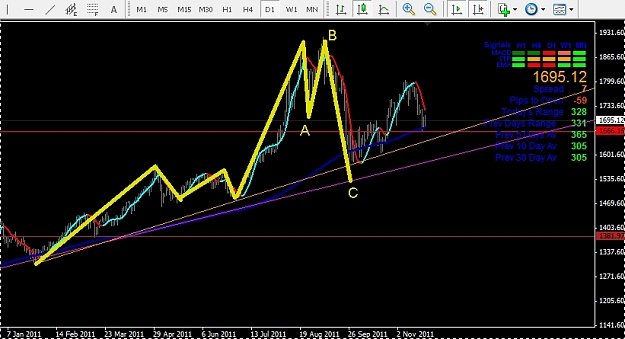
DislikedFirst is daily chart showing price target area for wave 3 of Wave C and then second is weekly showing price target area and likely time target for completion of Wave C by end of year:Ignored
Everyone out there...It's up to your own interpretation, I just wanted to present another view.
Attached Image(s) (click to enlarge)