Dislikedor put it like this,
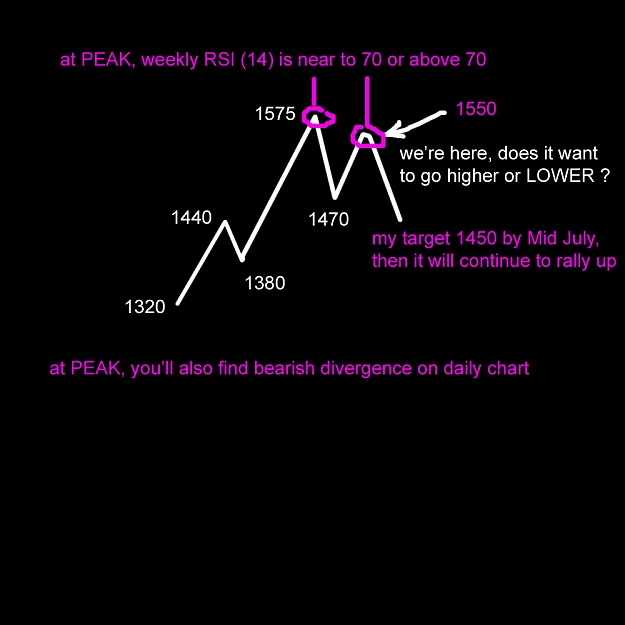
please shift your charts to weekly timeframe and with RSI (14).
see what happens when it reaches 70 level.
you'll see an engulfing bar down.
Gold is in a mega bull situation, but unfortunately it doesnt move up in a straight line. It moves in $100 then retrace and find support, then moves up another $100.
first wave was end of January, from 1320 to 1440 ($120 move up), then retrace to $1380 (pullback $50).
then after some consolidation. after breaking $1440, all the way to 1575 ($130), then retrace to $1470 ($100move...Ignored
OK -however my RSI readings are somewhat different to yours.....
If you accept that gold is in a mega bull, by using weekly readings to show you exhaustion/change of trend you would seem to be implying that the bull run is over. If however you were using shorter timeframes to tell you this, then you could scalp against the major weekly trend whilst still retaining a belief in the major bull trend......It just seems strange to use what you deem to be exhaustion indications on a very long time frame to look for a 5% retracement in the general trend...
beeb