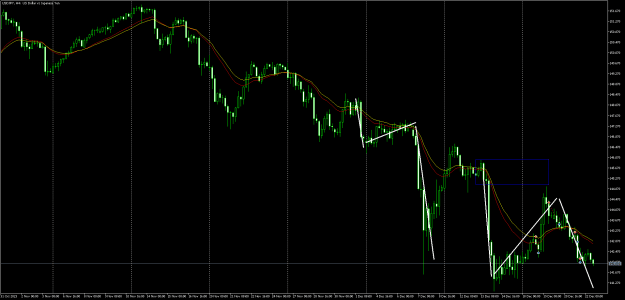
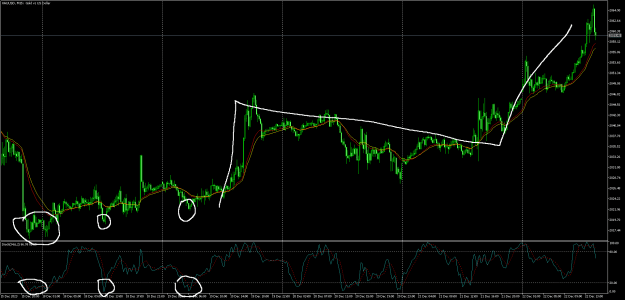
Almost forgot why I hate stochs, now I remember well, can go to hell this piece of shit, I don't learn {image}
Ignored
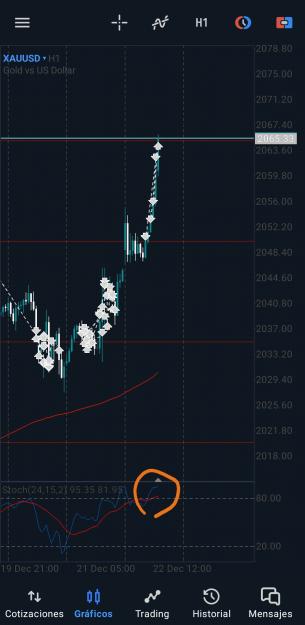
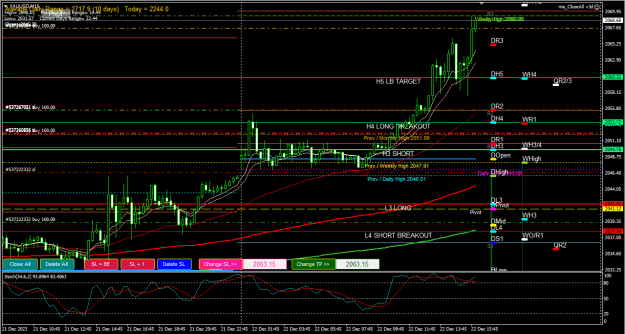
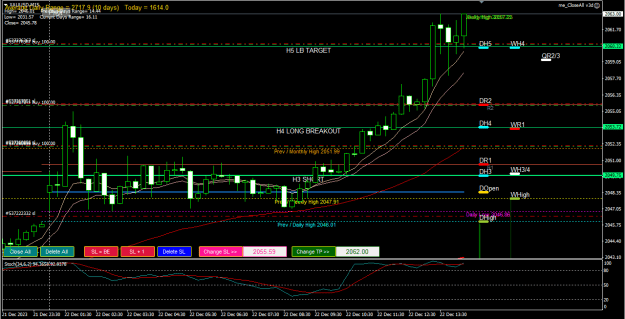
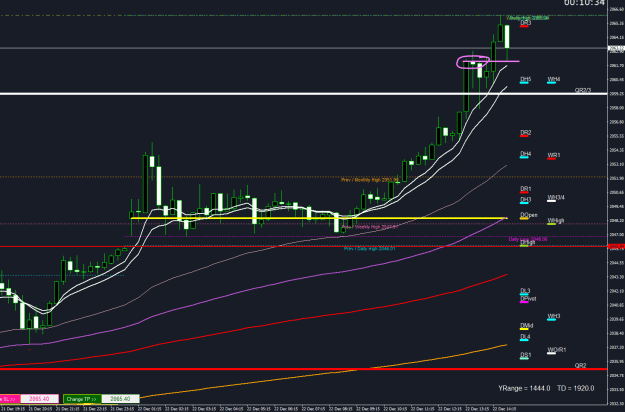
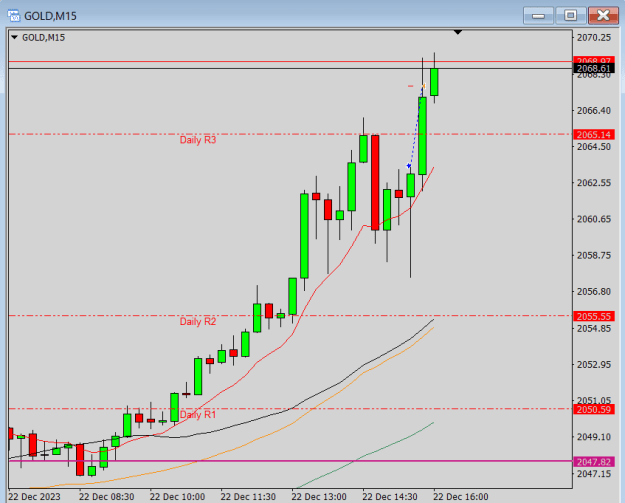
I'm also terrible with stochs, and learning like you, but I think when it gaps up like it did and never closed that gap, and it's also staying above last week's high, I'd be very careful with shorts until you get to the bigger levels
now jumping onto the train like Joker's doing is another matter I haven't learned yet
Attached Image (click to enlarge)
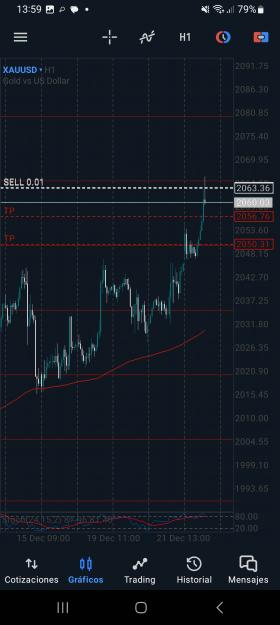
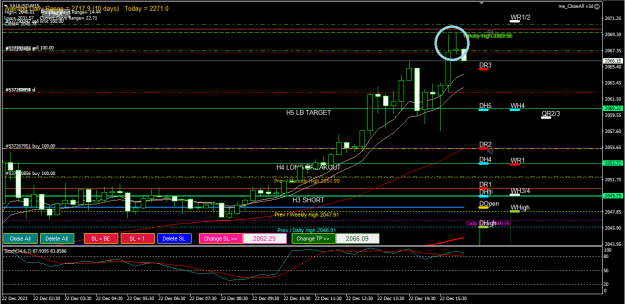
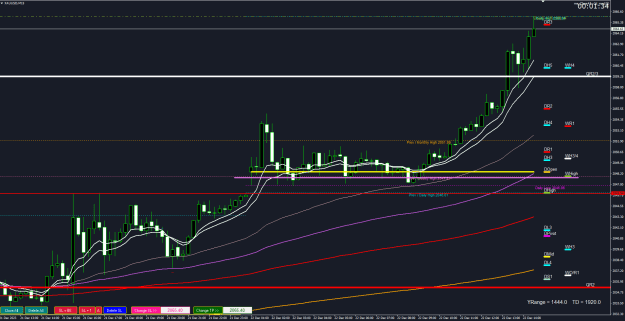
missed a work payment cause I'm a stupid poster
Attached Image (click to enlarge)
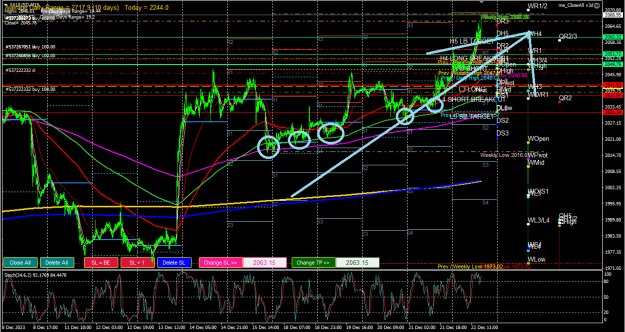
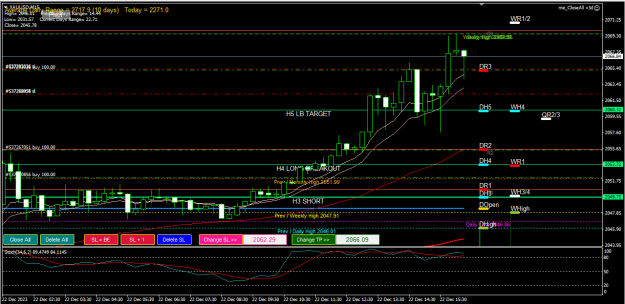
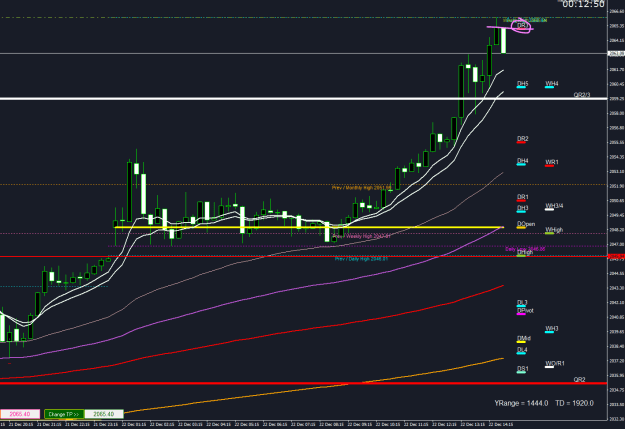
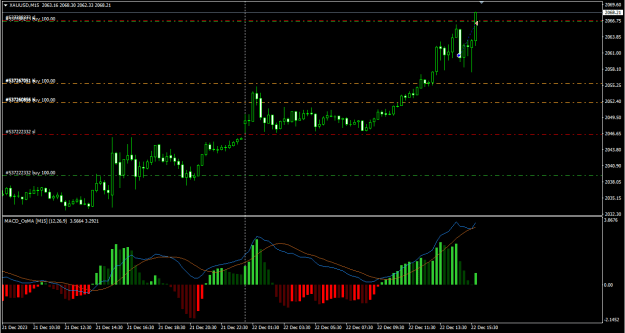
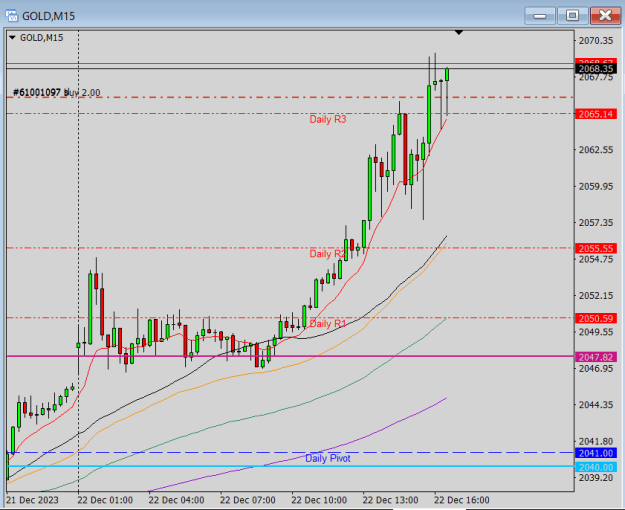
another possible work payment but too aggressive for me
{quote} I'm also terrible with stochs, and learning like you, but I think when it gaps up like it did and never closed that gap, and it's also staying above last week's high, I'd be very careful with shorts until you get to the bigger levels now jumping onto the train like Joker's doing is another matter I haven't learned yet {image} missed a work payment cause I'm a stupid poster {image}another possible work payment but too aggressive for me {image}
Ignored
Yes it was I tough, when gap and not closed at asia, fiercely to the other direction
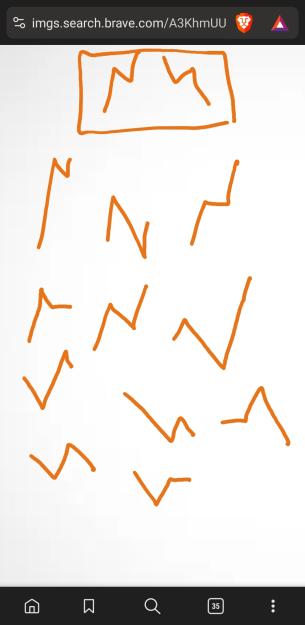
whas thinking about that and usually in a week there are 3 schematic bars, one directon then a retracement and turning on the direction at the end of the week, looking kinda harry potter scar or the patern you drawn, obviously the lengh of the every section, both in time or price, gives infinites varitations of the theme, but there is that inner strcture that is respected everytime
{quote} whas thinking about that and usually in a week there are 3 schematic bars, one directon then a retracement and turning on the direction at the end of the week, looking kinda harry potter scar or the patern you drawn, obviously the lengh of the every section, both in time or price, gives infinites varitations of the theme, but there is that inner strcture that is respected everytime {image} {quote} exacly,eit's above 200ema h1 so buy, sell it's damned if not good enough at it
Ignored
I think you are too overcomplicate this. These were just kind of flags what I shown, basically the bigger picture of possible direction and I mean possible and not saying it will go there
Messed up and now litigating, but well because start understanding the stoch, don't expect to do the things well first time, and it's demo so no problem, I see it exacly as the 200 ema at hourly, where it's pointing and where the price its relative of it, above below, it's the actual trend of the price nowadays uptrend as the price is above. Then we have the little weekly and and daily swings, and this is where I noticed, viewing yesterda's jr screnshots relative to that, where the stoch can be usfeul at the hourly the weekly swings and the m15...
Ignored
Are we above all MA's? This should give you some clues. You are making progress, soon everything will click in your head. Keep it up!
This is probably a good moment to call it a day. I wish you all a Merry Christmas spent with your loved ones because at the end of the day it is more important than money and everything else. I'll probably hunt BTC turtle tomorrow, but if not, see you after the holidays. Cheers!