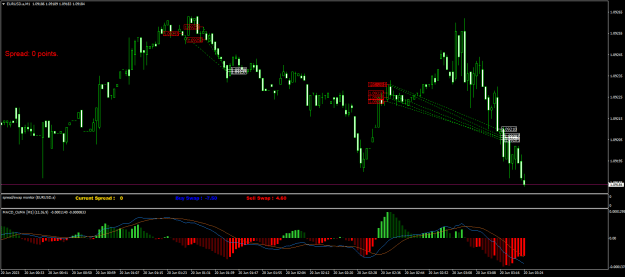
DislikedIt would be best if Jr. did it, he's good at explaining and better collector than me but I'll give you my point of view. At the outset, I would like to point out that I did not meet all these assumptions because today I tested a slightly different approach, some of them were met. 1.2 - at the beginning it is worth paying attention to what happened yesterday (in this case Friday) the price dived down strongly, reacting very close to Q open - the first hint. Based on yesterday, you can determine where it will be low and where it will be high. 3,4...Ignored
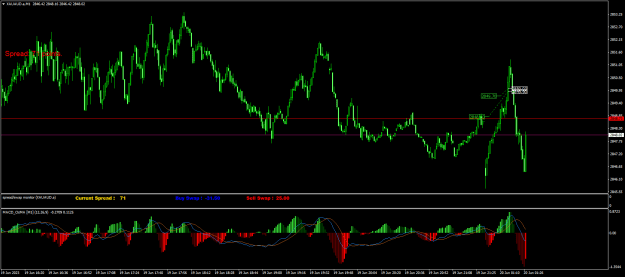
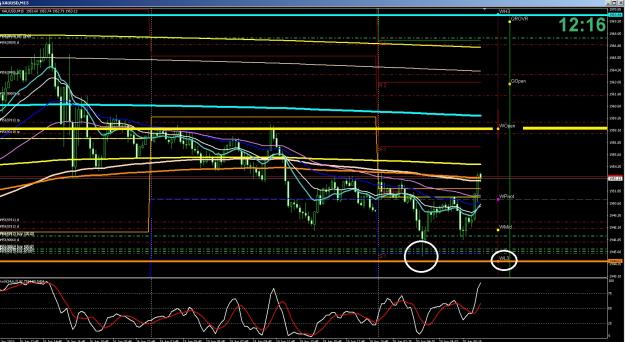
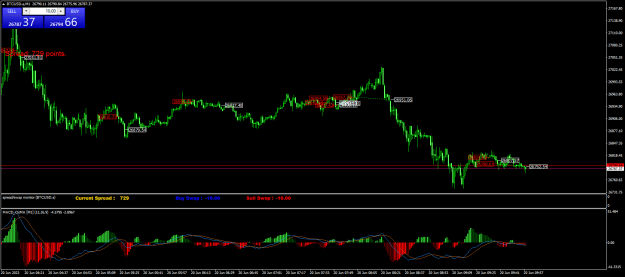
another factor that I would bring to the table is time, for example, the swerve in the 4 was at london open, 5 when tokio closes and 5.5 (lower of the day) swerved at ny open at the 1.272 extension of the tokyo range, if you analize closely friday did the same rithm, but in diferent form
Attached Image (click to enlarge)
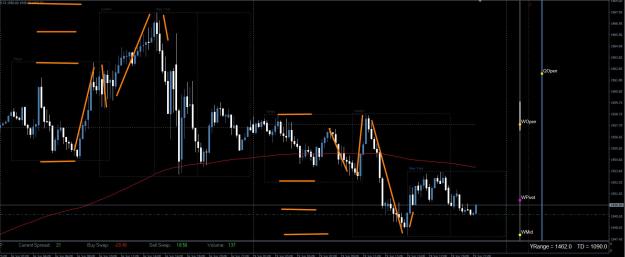
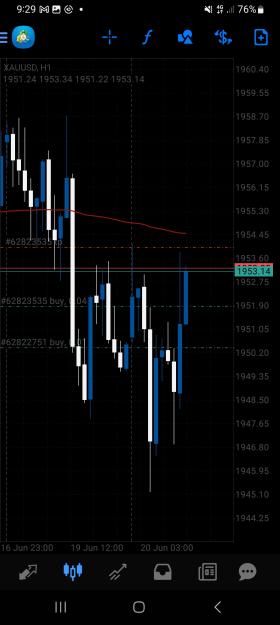
I'm pretty sure that you are aware of that, if not your subconscious is, that's for sure,because your entrances are really cordinated. the structure gets camouflaged because the direction and lenght is always diferent, for example the swerve between london open and japan close barely moved and makes the price look like just one movement, but there it is with all those wicks. I been analizing the price with the clock and some obvious movements are repeated everyday
Thank you for your explanantion mrjoker, great sharing, and I'm not sure that jr explains better than you
rip and tear until it's done
8