Joined Jan 2010
|
Status: The Voodoo Boodoo Club
|42,150 Posts
can almost hear somebody utter ,,, checkmate mfer lol,,,,, days and days of shit ,,, then a couple days for the merry go round to make a spin ,, and here it is
{quote} mete makes it hard to have a chart look the way it should at times ,, and the areas as mentioned above gonna be a pain munchie ,, but maybe just start with those 2 averages plus the 200 sma on hourly ,, maybe some weekly pivots ,,, think a lot of times your trying to read too much into the indi ,, that is 2nd hand info ,, we got to find something where you see it in price just like the price telling the indi ,, and then ya got to draw you important line s ,, {image}
Ignored
Attached Image (click to enlarge)
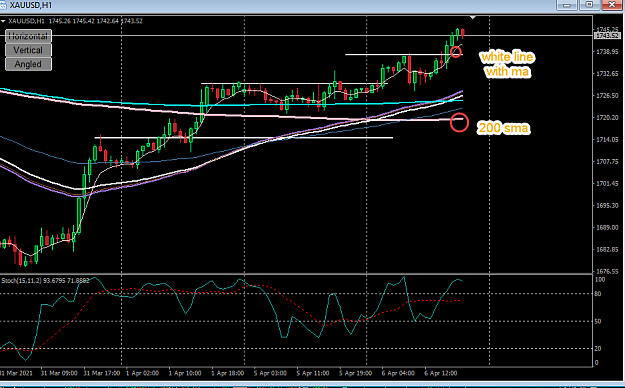
when you said 2 moving average is that white line ans sma200 pink color( my chart) i should follow moving average . Seem it easy with the other trader but hard for me , anyway i learned with eye but not mind iam not smart enough with mind ,take sometime with my hard way but the reward will be value to me because my effort to learn to be the same like the other trader whoever to be here.
{quote} {image}when you said 2 moving average is that white line ans sma200 pink color( my chart) i should follow moving average . Seem it easy with the other trader but hard for me , anyway i learned with eye but not mind iam not smart enough with mind ,take sometime with my hard way but the reward will be value to me because my effort to learn to be the same like the other trader whoever to be here.
Ignored
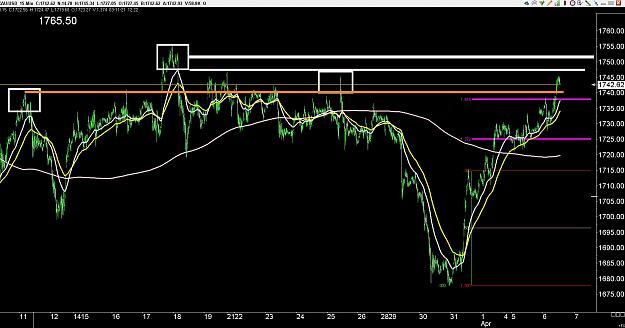
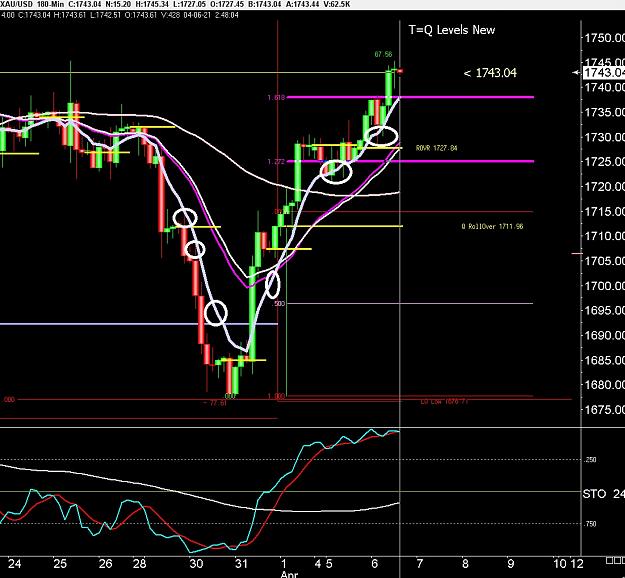
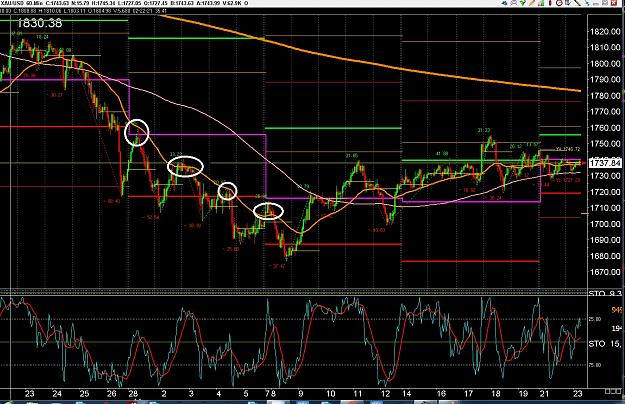
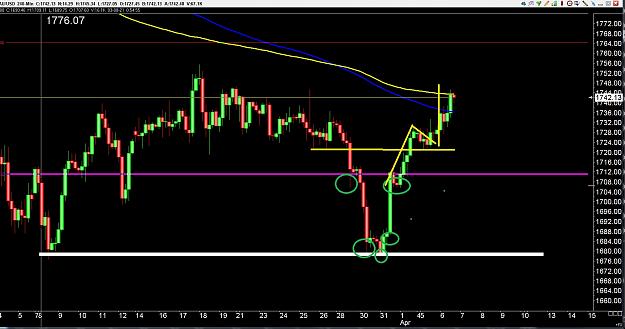
that last hourly there was 15 ema ,,, basically 15 hours of time ,, and a 24 ema ,, 24 hours of time ,,, when 12 above 24 its trying to go up ,, when 12 below 24 it is trying to go down ,, works okay when something is moving a bit ,, when flat well one of those areas as mentioned ,,, the horly 200 sma ,,, fibz barber shop ,, some of that above below shit ,, nothing seems to go long without having to visit the barber shop lol ,, it is the one circled on this chart ,,,, 3 months ,,, 1 quarter ,,, probably gonna take a shot at the midpoint ,, like shit does a lot of days ,,, thats what markets do lol
{quote} that last hourly there was 15 ema ,,, basically 15 hours of time ,, and a 24 ema ,, 24 hours of time ,,, when 12 above 24 its trying to go up ,, when 12 below 24 it is trying to go down ,, works okay when something is moving a bit ,, when flat well one of those areas as mentioned ,,, the horly 200 sma ,,, fibz barber shop ,, some of that above below shit ,, nothing seems to go long without having to visit the barber shop lol ,, it is the one circled on this chart ,,,, 3 months ,,, 1 quarter ,,, probably gonna take a shot at the midpoint...
Ignored
Nice Analysis Sir, Much Explained! Can You Rewrite the SUMMARY of these whole Analysis on XAUUSD
Joined Jan 2010
|
Status: The Voodoo Boodoo Club
|42,150 Posts
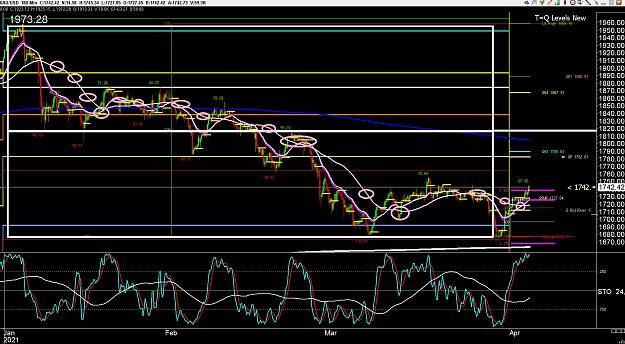
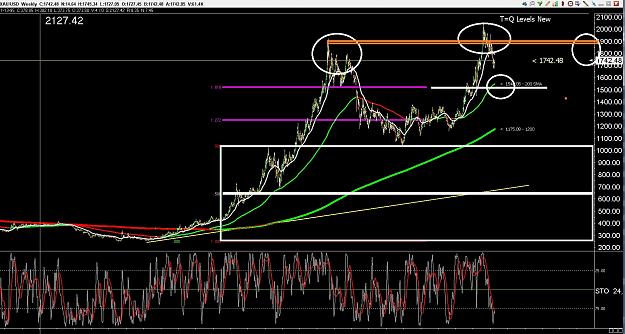
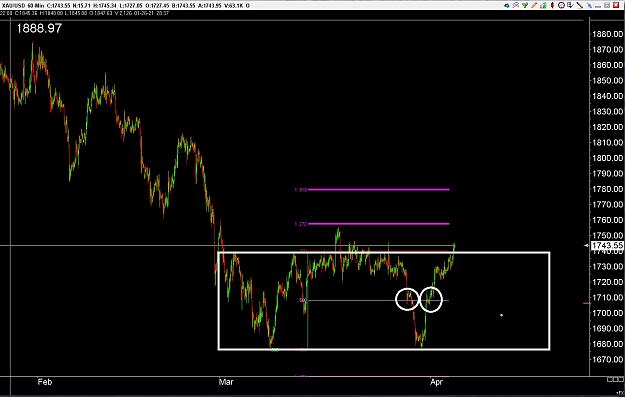
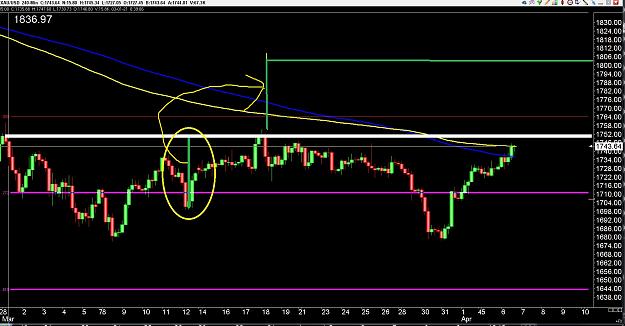
thats what it looks like on the grand puba ,, probably more than enough to keep er busy the next quarter ,, without any of the ridiculous Nostradamus predictions around the halls lol looks a bit different on the ole puba dosent it ,, lol but its the same ,, time and pips ,, creep creep creep on by ,,right under ones nose ,,, even when shit not going anywhere over all
{quote} that last hourly there was 15 ema ,,, basically 15 hours of time ,, and a 24 ema ,, 24 hours of time ,,, when 12 above 24 its trying to go up ,, when 12 below 24 it is trying to go down ,, works okay when something is moving a bit ,, when flat well one of those areas as mentioned ,,, the horly 200 sma ,,, fibz barber shop ,, some of that above below shit ,, nothing seems to go long without having to visit the barber shop lol ,, it is the one circled on this chart ,,,, 3 months ,,, 1 quarter ,,, probably gonna take a shot at the midpoint...
Ignored
the way you talked it was h1 but pics you sent h3 so all number 12 ema and 24ema what is the tf for that number h1 or h3. I am sorry seem like i go back basic one .Thanks
Joined Jan 2010
|
Status: The Voodoo Boodoo Club
|42,150 Posts
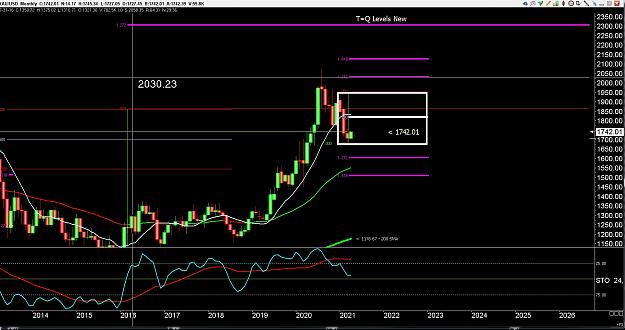
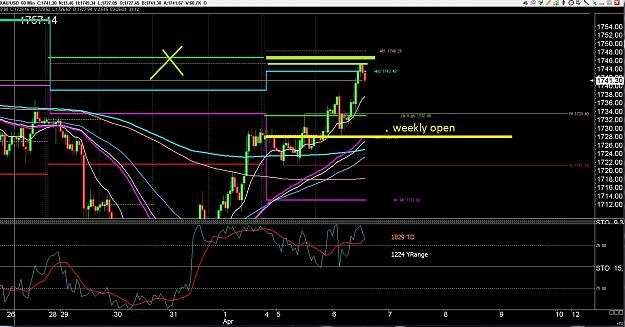
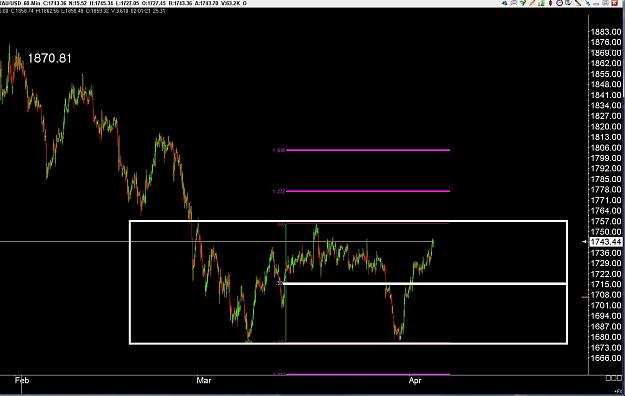
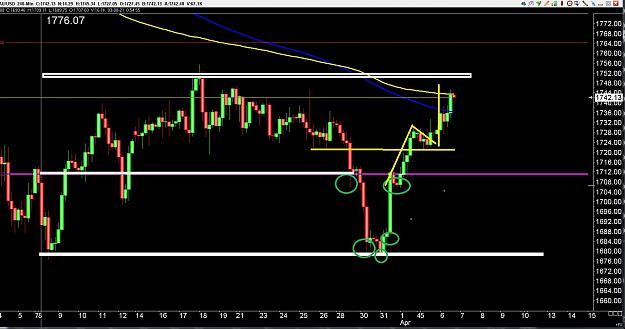
couple levels that didnt get to play last week ,, if they hold ,, wouldnt look for support that high ,,, maybe weekly open ,, with the barber shop creeping into the area below that,, it didnt just suddenly become a highly desired possession in the last few days lol,, wont be for the big boys till it hits the weekly 200 or the weekly 200 gets caught up ,,, that is something the real timmy traders will be keeping an eye on ,,, when that gets around it or it gets around that suddenly it will be desirable lol
Joined Jan 2010
|
Status: The Voodoo Boodoo Club
|42,150 Posts
its lost a bit of luster ,,, this is a soft dull yellow metal ,,, cumber some ,,, bulky ,,,, lol,, its being repalced with something ya cant see or handle ,, it really is nothing ,,, cp code ,,, its all the latest rage rofl ,,, argument is oh drug cartels its a way for them to transact business ,or illegal activity ,,, yes fiat paper has kept that from happening right ,, seems they didnt have much problem transacting business with paper ,,but its what ya here from those with some power ,, that want more and better ways to keep the masses under their thumb ,, , not much to do with illegal aspect of jack shit ,, that happens and will keep happening ,, ,,but when it comes to something ya cant see or handle,,,, much easier for higher ups to say you have it or you dont ,, ,,odd world isint it ,, reckon its all in what you want to convince yourself off ,, long as its trade able and a fucking chart moves ,, I will trade it and get a shekel I can spend lol,,one way or another ,,,
Hell this could keep er busy for a long long time ,, lol,,
{quote} the way you talked it was h1 but pics you sent h3 so all number 12 ema and 24ema what is the tf for that number h1 or h3. I am sorry seem like i go back basic one .Thanks
Ignored
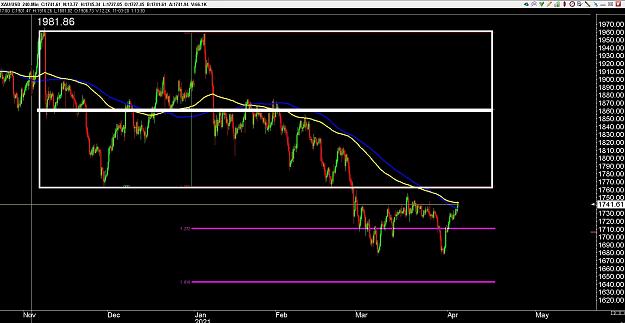
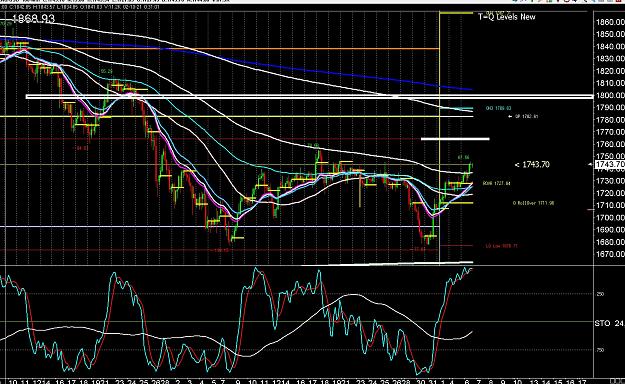
60 minutes equals one hour ,,, 24 hours in a single day ,,, so a 24 ema is a rouch 24 hour average price ,,, ya wont get the small ones on a 3 hour chart munchie ,, and 8 ema on a 3 hour is one single day ,, thats how you can figure them ,,, hourly is easy to figure shit ,,, ,, takes 24 hours to make one single day so a 24 ema on a hourly is gonna be a rough daily price average,,, m15 chart there is 96 m15 minute candles in one 24 hour day ,, so a m15 daily average price is gonna be a 96 ema ,, a 12 hour price average is a 48 ema ,, a m30 those 2 averages are a 24 and 48 ema etc etc ,, there is 8 180 minute candles in a day ,,, getting down there a bit now ,, ya see what I mean ,, heree is a 8 ema on 3 hour chart ,, its close ,, but it dosent quite look the same ,,
{quote} {image}when you said 2 moving average is that white line ans sma200 pink color( my chart) i should follow moving average . Seem it easy with the other trader but hard for me , anyway i learned with eye but not mind iam not smart enough with mind ,take sometime with my hard way but the reward will be value to me because my effort to learn to be the same like the other trader whoever to be here.
Ignored
ones there the magneta and the white ,,, a m15 200 would be in the center of those two munchie ,, m15 200 is kinda the 1st bigger one ,, it is a 50 ema on and hourly chart m15 200 ,, there is 4 m15 candles in one hour ,, 200 divided by 4 is fifty ,,, so a fifty on a hourly chart is a m15 200 ,,,
Joined Jan 2010
|
Status: The Voodoo Boodoo Club
|42,150 Posts
look at those 2 then look at this ,, this one would be inbtween them munchie ,, those same deal ,, when one crosses the other means a bit of a direction change ,,, with a single one there is no cross ,,
Joined Jan 2010
|
Status: The Voodoo Boodoo Club
|42,150 Posts
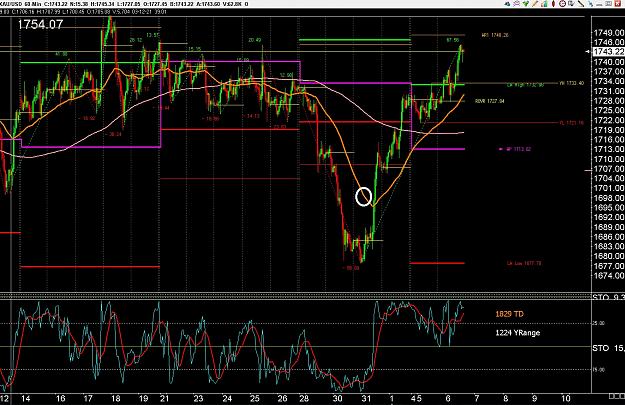
when it was just getting hammered ,, the m15 200 was a no brainier ,, it got to it ya whacked the living shit out of it ,,, now not much of a trend either way ,, altho we might get a little one up to that mid point ,, time will tell ,,, they are just tools munchie ,, nothing more ,, a line will tell you more ,,, a HORZONTAL line drawn at bigger levels ,, or lines like them boxes consist of
Joined Jan 2010
|
Status: The Voodoo Boodoo Club
|42,150 Posts
no question ,, no denying ,, exactly what the ones with the clout to move this shit was looking at there ,, none 0 zilch ,, no matter how you want too look at it ,,a level ,, they hold or they fold ,,whats it above ,, whats it below ,, where is the next one ,, where was the last one what time of day is it ,, done ,, end of story ,,, the game plays on ,, its back to ,,, checkmate ,,, your move fatty short finger ,,
Ok I got it , I will go back and learn for ema , honestly when i trade i did not remember what tf on ema but whatever the line you made it bigger than the other i pay more attention for big one and the moving average small one around the price . Thanks
Joined Jan 2010
|
Status: The Voodoo Boodoo Club
|42,150 Posts
bit of double bottom talk around some parts lol,, there was some of that not so long ago too ,, ,,moon still no closer ,, remember the rough monthly average,, 4 hour chart 200 munchie ,, ,,swing spots ,, dont feel like you just have to be in a trade for the sake of being in a trade ,, do your home work ,, find spots ,, then wait ,, take your swings ,,, ,, from your spots ,, lock in the runners ,, use your tools ,, see what they do when they get certain places ,, you gonna see shit 1st before they are told what to do ,, ,, little things ,, your home work ,, whether on the chart your looking at or not ,, ya got to know where some shit is at ,,, hard to have everything on a single chart ,,, ya wont see price lol,,, but that is part of the home work , etc etc little things ,, seems like a million but there isint ,, just need to get the repetition down ,, then it just becomes a bit mechanical ,, your doing homework close to eod as the chart is still moving ,, but you still check the important shit ,, with practice it will come ,,
Joined Jan 2010
|
Status: The Voodoo Boodoo Club
|42,150 Posts
practice ,, draw some lines,,,find some patterns ,, draw some shit that looks like shit ,, practice practice practice ,,, bounced off a low ,, it is above a daily price average ,, a half day price average is above a daily price average ,,, stochs working above the fifty on shorter chart ,, longer chart its pegged to the top ,,, put the pieces together ,, where is price gonna go ,, ??? there was a projection ,, ,, and now price is there ,,, ,,
Joined Jan 2010
|
Status: The Voodoo Boodoo Club
|42,150 Posts
ya know where the neckline is for up right ,, ,, ? if it takes out the line where might it go ,, ??? if it clears the line wheres it gonna try and go ,, I would use that for a shoulder to start with ,, then see what lines up with that for weekly numbers or see whats there for previous levels ,you know you are above quarterly open ,, you know what comes next many many days ,, find the pivot ,, find the mid point ,, they both above ,, H3 is above ,,new quarter new line in the sand ,, same ole shit ,, ,but know that shit ,, know where its at ,, etc etc ,, you a gold trader ,,its your fcking job ,, you want the cash you gonna have to work ,,, you cant just watch price go up and down ,, hell anybody can do that and most thats all they fcking do ,, you gonna get payed and be good at your job ,, you do more ,, you ,,well you do your job PERIOD ,, when you do ,, you will start getting payed ,, and the more you do it the better you will get ,,, etc etc
Joined Jan 2010
|
Status: The Voodoo Boodoo Club
|42,150 Posts
lets see whats around them parts ,, may take a few days or the boys may just say fuck it ,, lets get it over with ,, could take it a bit to chew thru shit ,, but that is what ya got for some pieces atm ,, and atm its a chewing up ,, probably be a wallope or two ,, may get its ass knocked back to the barber shop once or twice ,, but if that where its going there will be a level where it catches itself ,, picks itself up and gets dusted off and trys again ,, or fatty short finger starts packing them straws on the camel till the camel breaks ,, ,, thats trading munchie ,, ,, no set and forget ,, no sure thing other than your ability to track the sum bitch and kill it ,, you know how a day works ,, it starts with a line in the sand ,, , above or below ,, whats next ,,certain spots certain times shekels hide out everyday ,,, , etc etc draw them lines watch the clock ,, start collecting some of those ,,