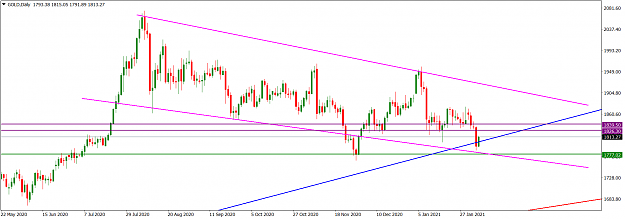
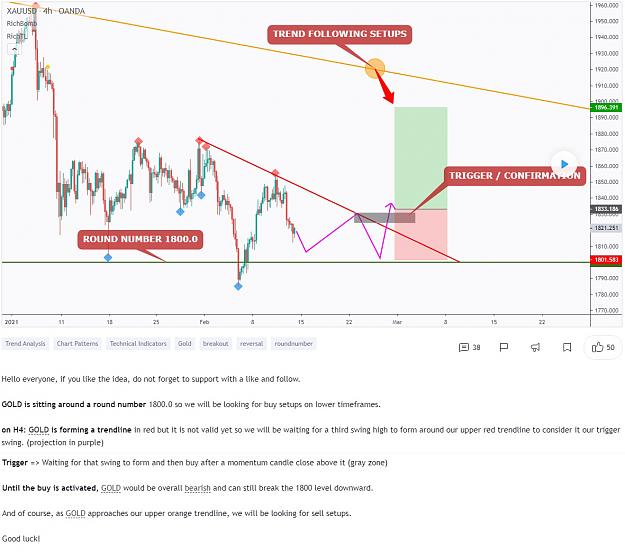
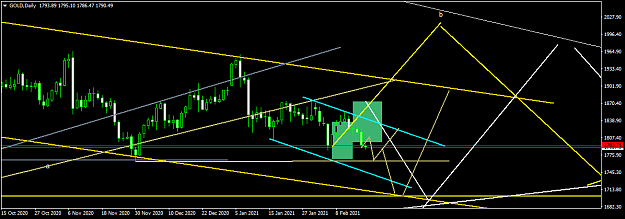
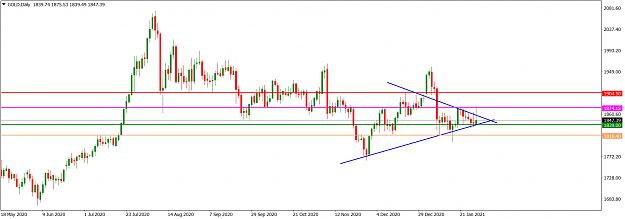
If you are tracking the XAUUSD this week, consider this technical perspective. Recent XAUUSD price action on the daily time frame is consolidating within a triangle (blue). Last week Friday, an inverted hammer print was formed at the confluence of the 1839.00 horizontal support area (green) and the triangle support trendline. Nevertheless, we may expect a breakout from either side of the triangle. A bearish break down of the area may see bears target the next horizontal support around 1816.40 (sandybrown) while a bullish breakout may see a retest of the 1874.15 horizontal resistance (magenta).
I may be wrong. Trade safe and prosper.
KP
I may be wrong. Trade safe and prosper.
KP
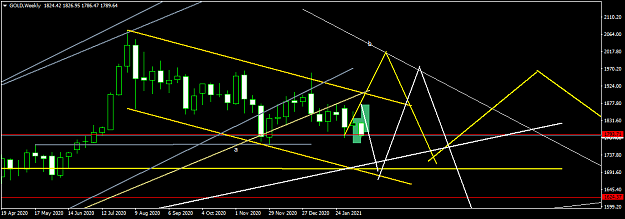
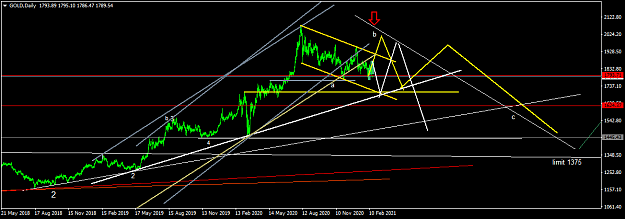
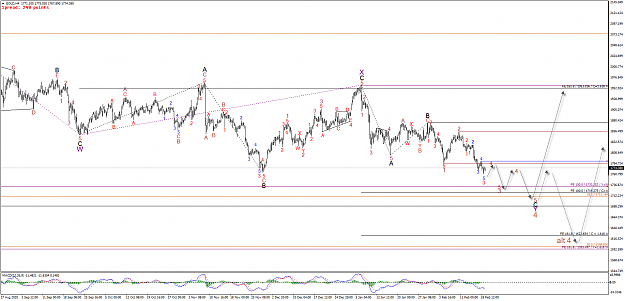
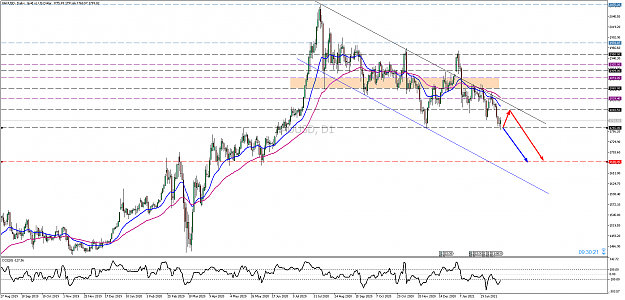
Attached Image (click to enlarge)
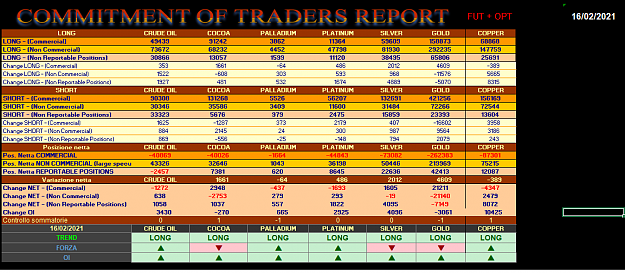
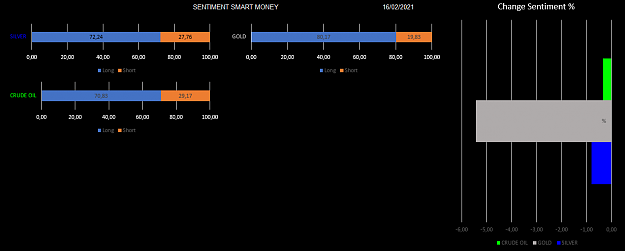
Do your homework, follow the footprints of smart money