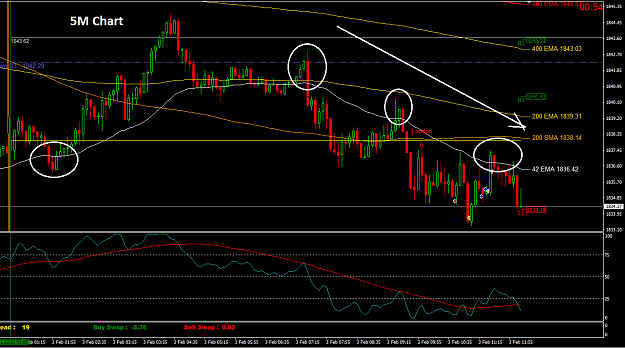
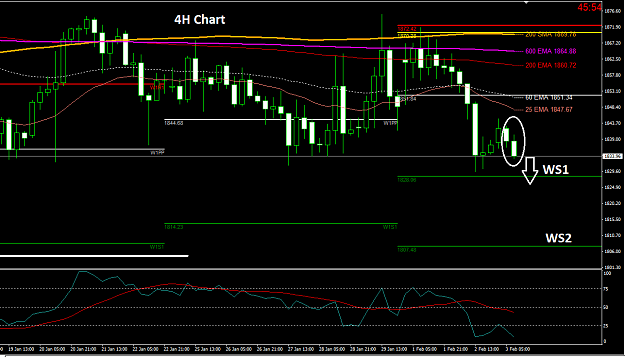
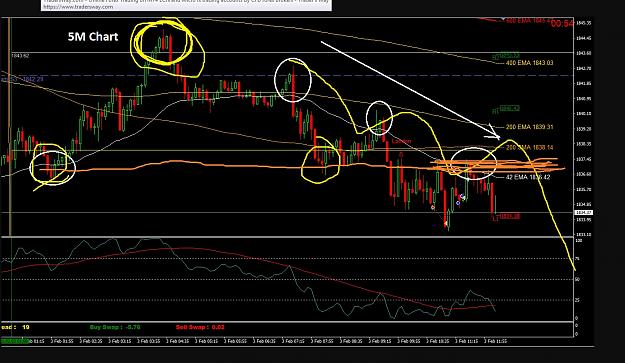
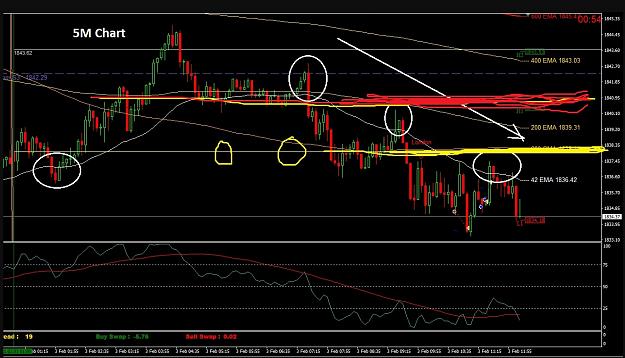
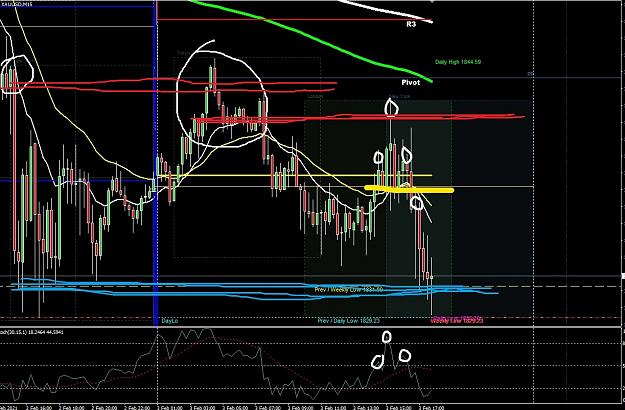
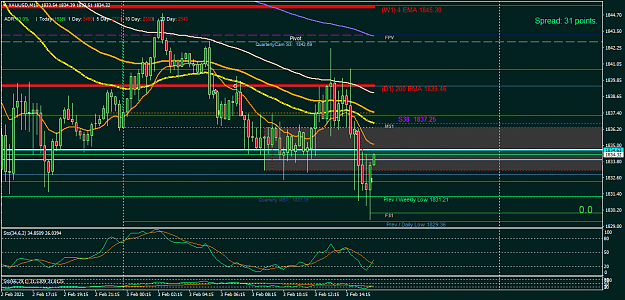
bigjis ,, put a 42 ema on your m5 ,, then look at that compared to the stoch ya got on that chart ,, see what ya see ,,,,what you will see if using a little common sense ,, is basically what the golden boy piece of shit 4 hour chart is doing ,, in m5 form ,, not quite 4 hours worth of average price ,, which way is his stoch headed atm (4 hour chart) ? has been for 4 hours plus into the 2 nd 4 hour candle ,, that whole 8 hours grinding on by thing  4 hour chart probably thinking hmmmmm WS1 ,, weekly low from 2 weeks ago ,,, and it be under ole fatty long fingers 1838 quarterly level,,,not a given by any means yet lol,, but monitor bottom support may move lower ,,monitor bottom support not reliable ,as is monitor top res is not reliable , lol shit can grow especially on m5 or m1
1
9