Joined Jan 2010
|
Status: The Voodoo Boodoo Club
|42,150 Posts
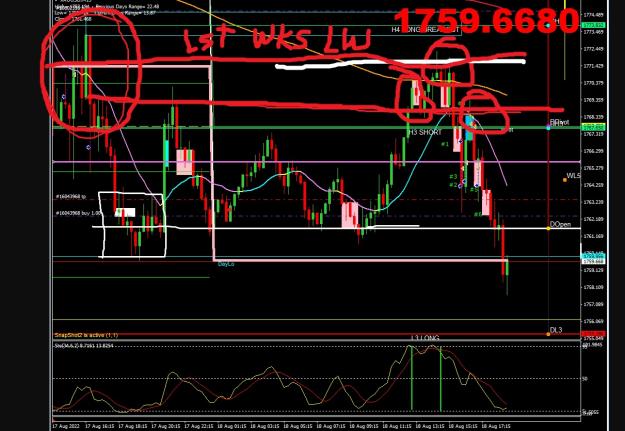
jr , clssic pmp an dump, dump at lst wks lw and tht 800 ema on m30 which it lst the hndle on , algo patrn started in 1st blck circle, learn em , rght side up an upside down for lngs ,if othr wy it is a clssic dmp an pump tody nw yrk goes hgher or lwer from here, only done 115 for dy so far so sum on either end yet or one end , even if a dull day
jr bys got pockets full of em bck on the 3rd , lk wht price is a trying to do here and what culd trnspire by eod , think crbon copy if the boys hve the pucker string pulled tight, and if it turns out to be a crbon copy , one knows there culd be a lower low yet today, if /whn it does , would imagine the boys may have some bigger sh=t loaded , aafter all how could one do the "where has it been what has it done " review for the week going into the weeks close
Joined Jan 2010
|
Status: The Voodoo Boodoo Club
|42,150 Posts
jr , oooy did have the list taped on dash whittled down good, then dropped a load off and picked a load up in the mountains , seen the devils advocate while thr , ha pops , list grew again ,back to stying ahead of the devil wont be in school on time for sure , have fun all
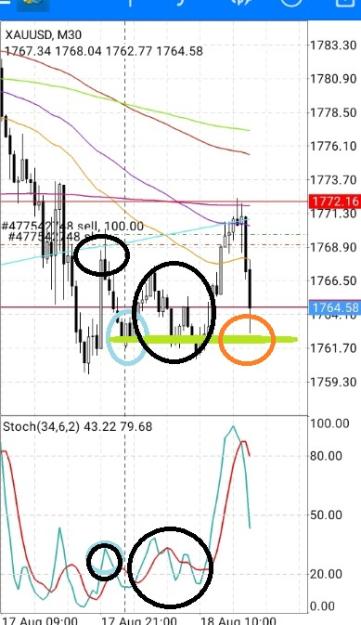
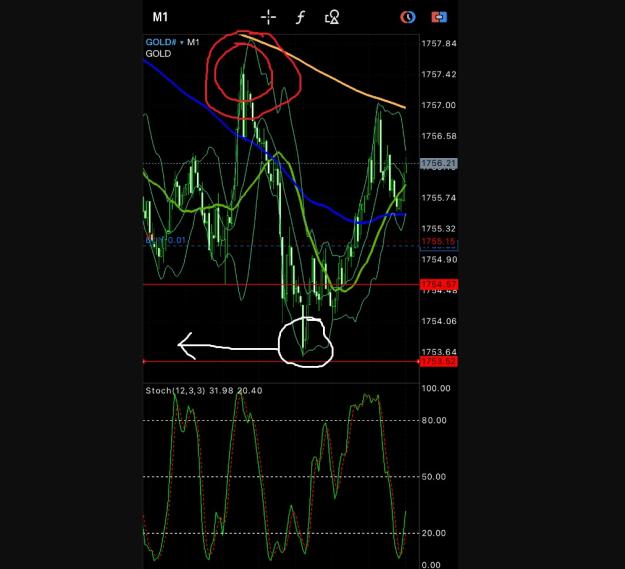
{quote} Well, I am no authority on this but what I have learnt from Diggs/Jr is that when price is moving and comes across an 'obstacle' (like a level or ma), it will retrace and form one of these flaggish areas before breaking that level. Whenever price comes back to that point it usually will react. Look at this chart for example. One hour gold. There are a number of such areas. White arrow. Price came across that blue ma. See how it went back to form one of those before punching up to break it. The rex 'x' is when it came back to that area. Red...
Ignored
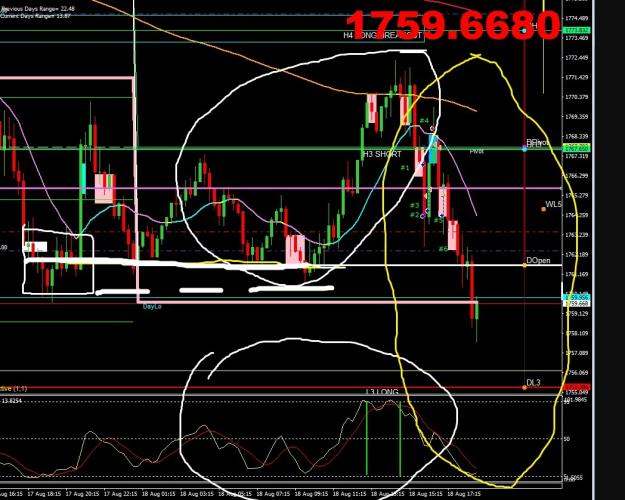
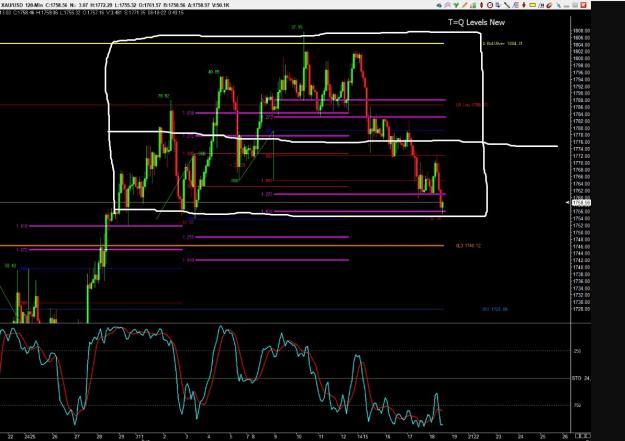
jr , since failure at QT open , do the same only upside down , it will find one it likes eventually , price filled in on this chart now, last in line is the monthly sma , I think thats what that average is circled , faint in the picture but it is looming quite large
i do like to see a trader learning and making money quintox this threads is about give traders a real go might take some time but its worth it in the end i should have thought a big more , but alls is good
Ignored
best way to learn ANYTHING, is to do the work. Here, that means read the thread, decipher, think, test, try, repeat repeat repeat. All four of our children were educated in Montessori way which is far more about letting the person find the answers. Guidance is given, but the person 'discovers' the solutions. Once discovered, it is not forgotten. When TOLD, it is always forgotten because it is NOT understood.
Making money here is NOT a sprint, it is an endurance marathon. One reading of the whole thread is NOT enough. One reading of a post is often not enough. Take the time to learn, look closely at posted charts because they hold VALUABLE info on price, time, pattern, levels, circles. boxes, and much much more. Ask questions for sure BUT perhaps carefully consider if the question i worth asking OR if the answer was already provided (almost ALL of the good questions have been answered in this intense thread.
Been away a few days for R&R. Back today, 5 good trades, 1 stupid one (#6) where I KNEW what market would do instead of watching. #1 was also not great but i was comfortable in considering mkt would retest upper levels.
Anyway, great to be back and realize i know little still. Even after over 8 months here I am still wading through the info and learning. But pretty cool to make money as I learn and test my interpretations.
Joined Jan 2010
|
Status: The Voodoo Boodoo Club
|42,150 Posts
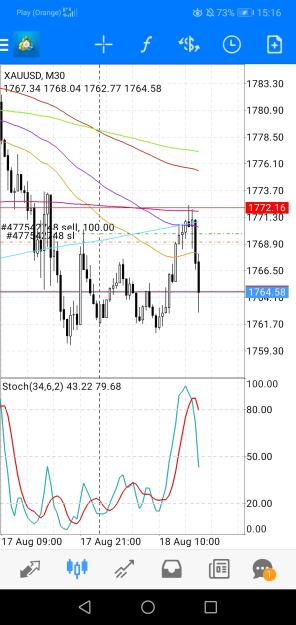
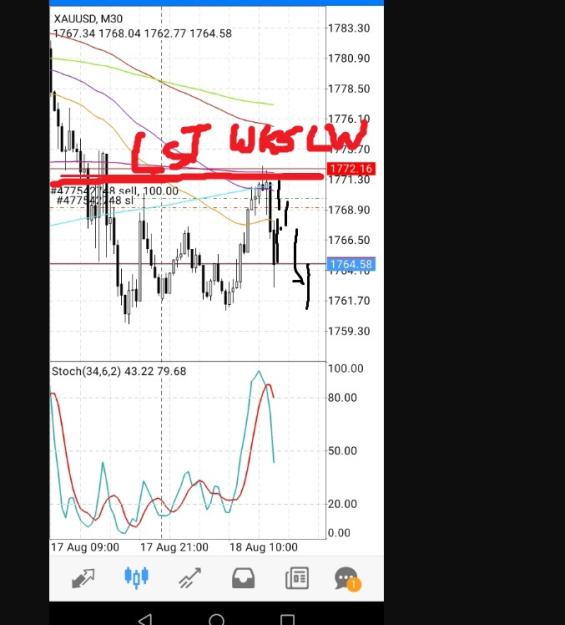
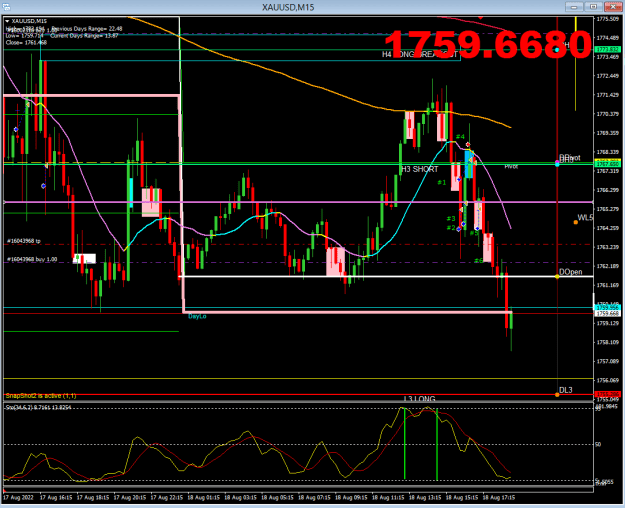
jr , hadnt got on the big road yet so stopped to post it , figured it may help some , last weeks low sold off yesterday , did get above the shoulder , but that is how it does things , dosent know if it can hold something till above or below , in this case , last weeks low , whacked again and shoulders they do what ? carry the load or drop it like its hot , musta been hot today , out and gone ,
Joined Jan 2010
|
Status: The Voodoo Boodoo Club
|42,150 Posts
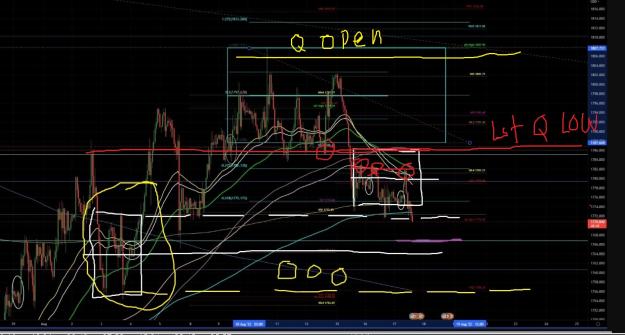
jr , ooy , blank , will post this too , if one "thinks" think in terms of the "cycle" that is "just another day" the whole thing from when the startingline shows up into new york , then its a whole new day , new yorks slot in yellow ,, and Mr O , the gyration is always a retest of something up or down , then new york settles in and does what they a gonna do the rest of the day ,and when eod rolls around , welp new starting line and the exact same sh=it show starts all over again , one plays that cycle like a fiddle in time and with a little practice , that is how this sh-t goes about its business daily , day in and day out , week after week after week
Joined Feb 2018
|
Status: Digger1 Apprentice
|1,225 Posts
this is some good stuff to work with but right now i am into 2 hr chart why would one should go for the box you drawn while other is also there if drawn properly i know you told many times lines passing from what stuff need to work more on that as well
this is some good stuff to work with but right now i am into 2 hr chart why would one should go for the box you drawn while other is also there if drawn properly i know you told many times lines passing from what stuff need to work more on that as well{image}
Ignored
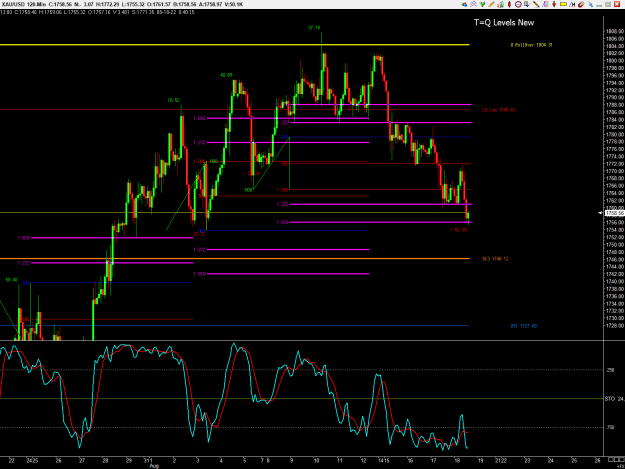
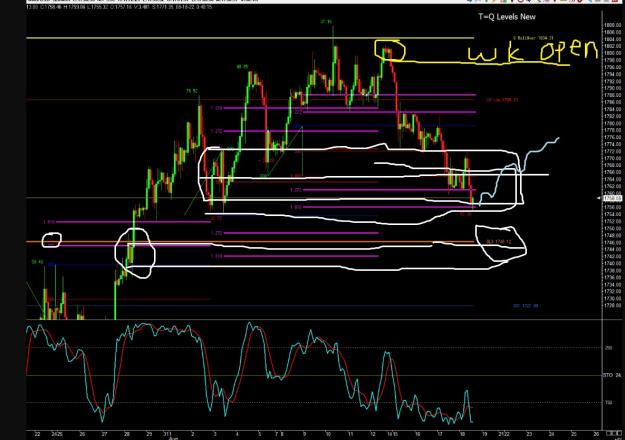
jr , bys gona run out of wk ha , blank , like me , lttle thngs , at a WS2 rght nw , woud lk fr tht sme ole sme ole to build arnd tht and then knw whr the mid point of current week is at at eod tday , could gt the creepy crwlys bck towrds wk opne , lst qters lw prbly bout mid pnt right nw of curnt wk , if they kp pouring it on wl ya knw whats next, 1 of Mr Whitefres buds mrks the spt, Q L 3, wuld watch for a good nik clause thr Ws2 thn the creepy crwlys , but bys may b ovr it for the wk and the pucker string may hold , tight as a bnjo string right nw, c wht the aussi s get started when the nw line shws up, tht sur is a purdy chrt , blnk , mis my ensign chrts ha, doing sh=t the old fshioned wy right nw nt much tme to wrry bout it anywy
Joined Jan 2010
|
Status: The Voodoo Boodoo Club
|42,150 Posts
jr , ya prbly hve a fw extra bxes u start with the big and narrow it down to things like Mr Whtfres buds , hve the bg 1 at bttom and ths arund Qtly opn and lst qrter lw , they all play the sme , u jst need to member how a wk plays out , week aftr week aftr week etc etc and they play in the qutrly lvls, that what lnes up with what fr the wk for the day etc etc ,nt scribbled prfct , but , gtta keep whls rlling , u got ths no wrries, as the wk plays out u milk the sh=t out of the dly cycles it wl be one of 2, the pmp and dmp or the dmp and pmp , while it drifts a bit 1 wy or the other ovrall
this is some good stuff to work with but right now i am into 2 hr chart why would one should go for the box you drawn while other is also there if drawn properly i know you told many times lines passing from what stuff need to work more on that as well{image}
Ignored
jr ausi bg boys rght on tme , bit of a nk clse thru tht ws2 an ystrdys low , dukes up , dy is under way
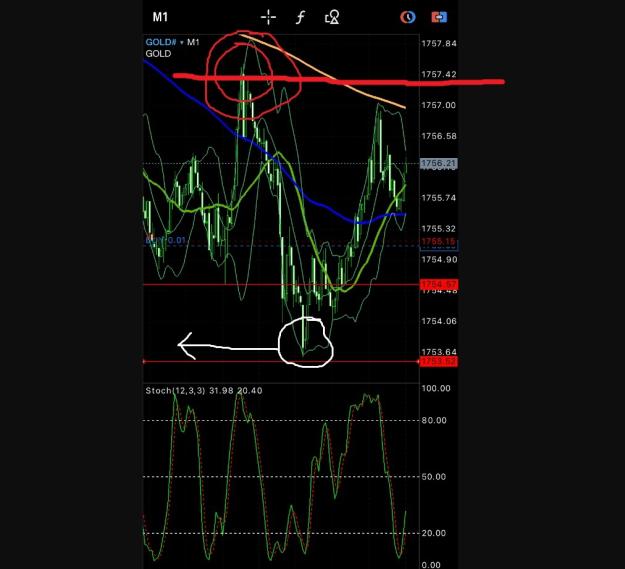
jr , les lts of exprence , u wll be lost in the jngle in no time with no sense of time , , its traded undr dys opn since it opned rd crcles was an add on frm dys opn gtting whcked , folow arrow lft u will fnd the nxt in line that the bys didnt get pulled off ysterday , a Dly S2 or mybe a S1 , working from phn , sux it was nxt in line anyway ha, also jst touched the next mnthly ave in line the sma mentioned prviously ,boys have it up to bout 60 for the dy so far , all undr the dys opn , ystrdays low now may hold for a bit , as said unls sum exprnce , the bcking bronc wont do ya any fvors, espcially on a phn screen