something I noticed: we have daily inside bar that broke to the downside ... if we could get up to the upside of that we would have a daily fakey which would be a rather bullish signal long term.
{quote} Actually I see cvds16 statement "obviously not going up at this moment: short @ 1261.25" way less harmful than numerous calls for long that I read in this thread during last two weeks.
Ignored
True, but I didnt comment on the specific call, rather on his frequency of changing opinion and direction. In my mind with this strategy, factoring the in and out costs, it is impossible to make money.
"Bulls make money, bears make money, pigs get slaughtered"
They, just took it up to the DLY Open. How many times have we seen that! Cheers, U2
Ignored
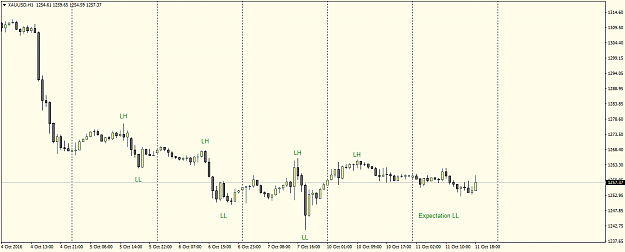
on the hourly there is a lot of resistance for Gold. But once this is through (above 1261) then next stop is 1273, then 1285 and 1301. Same thing for XAG needs to break above 17.61, then 17.92, 18.24.
"Bulls make money, bears make money, pigs get slaughtered"
{quote} on the hourly there is a lot of resistance for Gold. But once this is through (above 1261) then next stop is 1273, then 1285 and 1301. Same thing for XAG needs to break above 17.61, then 17.92, 18.24.
Ignored
Still early . Just ranging . Fundamental I would expect it higher. TA lower
I will wait for an HH before I start look for trades on bounce from new HL.
Very basic.
Can loose the train if it spikes up but I do not worry to much about that.
{quote} Which were all there a month ago and two months ago and ..... meanwhile Gold continues to drop. That tells me they don't matter. At least not presently.
Ignored
Yes nothing new. It is long term and on higher TF this is a retracement.
{quote} Yes nothing new. It is long term and on higher TF this is a retracement. {image}
Ignored
So you trade on weekly basis and holds for months at a time?
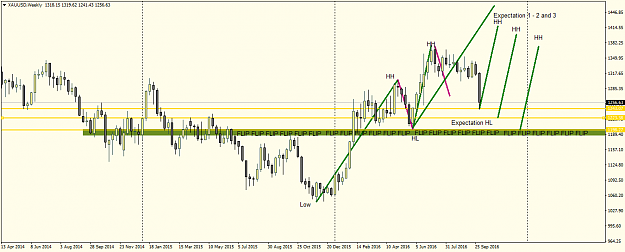
I see your own chart shows (pink trend lines) on down move that the current one is longer than the prior one. Also although you don't have them marked there are plainly LL's and LH's recently.
{quote} So you trade on weekly basis and holds for months at a time? I see your own chart shows (pink trend lines) on down move that the current one is longer than the prior one. Also although you don't have them marked there are plainly LL's and LH's recently.
Ignored
I use S/R levels from higher TF Daily, weekly, monthly and also ratio ++ to find confluence ( The pink lines and also the green ones are based on ratio and they have same length to predict possible length of swing from the previous swing) . I mostly do my entries on lower tf and sometimes direct at S/R level where there is strong confluence.
My trades often last for long time, months are not unusual to get most of the swing if I have strong outlook in the direction of the trade ( F.ex strong buy in gold is good enough to hold to 1420 area if it takes a month or 3 is not critical but not perfect for gold since there is a small swap to pay for longs.
If you take every small swing I agree there is LL and LH also on weekly I choose to look the main swings there. To find the LL LH just to go to lower tf. 1 H that was in my first post also show that. I wait for HH and HL on 1 H since the first level of Support on higher TF held for now. If we get that I will try to get in from a bounce HL.
{quote} I use S/R levels from higher TF Daily, weekly, monthly and also ratio ++ to find confluence ( The pink lines and also the green ones are based on ratio and they have same length to predict possible length of swing from the previous swing) . I mostly do my entries on lower tf and sometimes direct at S/R level where there is strong confluence. My trades often last for long time, months are not unusual to get most of the swing if I have strong outlook in the direction of the trade ( F.ex strong buy in gold is good enough to hold to 1420 area...
Ignored
I have drawn pink TL's just as you have them. Can't you see price in current downswing has gone beyond (100%) what the previous swing did?
Also the current swing is longer in time 14 weeks vs 4 weeks. In other words what is referred to as a time and price overbalance. Signalling a change in trend.
Also you say you look at main swings on weekly to find HH's LL's etc but then look down at 1 hour level. Huh?
My chart has recent pivots marked with numbers and letters - all with at least 2 HH's above each swing low and at least 2 LL's below each swing high. Good enough for me.
{quote} I have drawn pink TL's just as you have them. Can't you see price in current downswing has gone beyond (100%) what the previous swing did? Also the current swing is longer in time 14 weeks vs 4 weeks. In other words what is referred to as a time and price overbalance. Signalling a change in trend. Also you say you look at main swings on weekly to find HH's LL's etc but then look down at 1 hour level. Huh? My chart has recent pivots marked with numbers and letters - all with at least 2 HH's above each swing low and at least 2 LL's below each...
Ignored
Funny
Seems like you take it personal .
I completely respect your point of view. Nothing wrong with it and yes gold is going down atm, It will change at some point and I want to be with on the way up again. The pink lines was a possible turn zone for the swing and even I saw it was overextended. A way to see that it is possible oversold also. Nothing wrong in looking at at different TF. If you have problem with it. Just dont look. And as you see from my weekly I have 3 different support levels for this down swing. Last down to the flip zone.
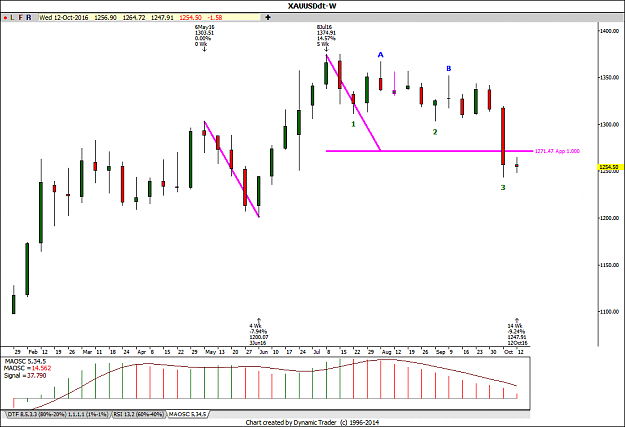
XAUUSD 1H Chart: Double Zigzag Correction complete? Looking for a Long trade. Last 2 trades BE only. Cheers, U2 EDIT: Long $1256 TP ??? {image}
Ignored
In silver we are already through some of the resistance zones that I mentioned yesterday. It will be possible if it consistently breaks through 17.61 to reach at least 17.78 if not 18.10.
"Bulls make money, bears make money, pigs get slaughtered"
![Click to Enlarge
Name: XAUUSD 161011 8H [1].png
Size: 43 KB](/attachment/image/2037521/thumbnail?d=1476194516)
![Click to Enlarge
Name: XAUUSD 161011 12H [1].png
Size: 74 KB](/attachment/image/2037782/thumbnail?d=1476208922)
![Click to Enlarge
Name: XAUUSD 161012 1H [1].png
Size: 76 KB](/attachment/image/2038119/thumbnail?d=1476255745)