TP & SL Tool: Risk Reward Ratio Calculator RRR MT4 | Prop Firm Protector: Trade Assist Prop Firm Plus TF Expert MT4 | Money Management + DrawDown Protector: Trade Panel Prop Firm Drawdawn Limiter Pro MT4 |Get a free Expert Advisor license via Telegram and WhatsApp
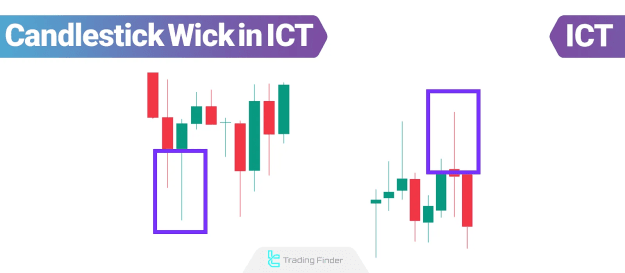
The Candlestick Wick in ICT serves as a critical tool for identifying:
- Short-term support and resistance levels
- Potential price reversals or trend continuations
- Strong market reactions to key price zones
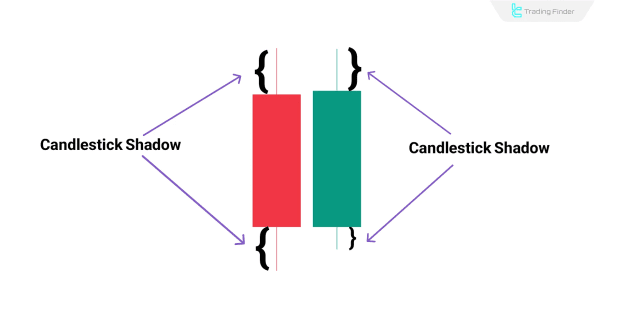
How Candlestick Wicks Are Formed
To analyze candlestick wick trading in ICT effectively:
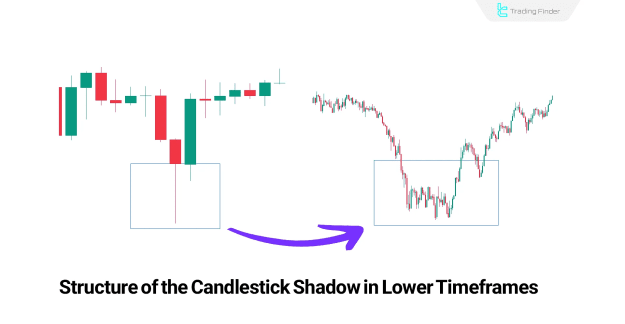
- Identify wick formations in the primary timeframe.
- Zoom into lower timeframes to observe the internal candle structure.
This reveals:
- Aggressive price reactions
- Liquidity pools where price penetrates but fails to hold
- Institutional order flow through rapid rejections
Analyzing Candlestick Wicks in ICT
Types of Candlestick Wicks
- Long Upper Wick
- Signals strong selling pressure
- Indicates liquidity absorption at higher prices
- Often marks a potential reversal zone
- Long Lower Wick
- Reflects strong buying interest
- Shows demand absorption at lower prices
- Suggests a possible bullish reversal
These wicks act as liquidity zones, helping traders anticipate institutional order execution.
The 50% Wick Level in ICT Trading
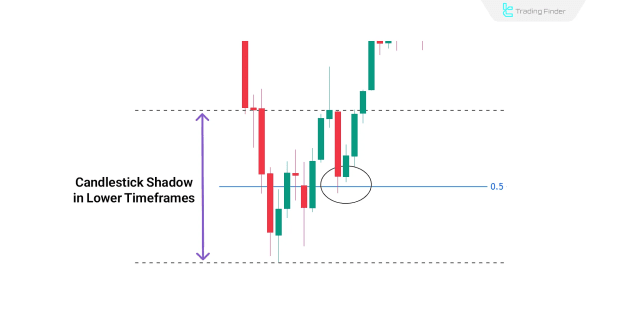
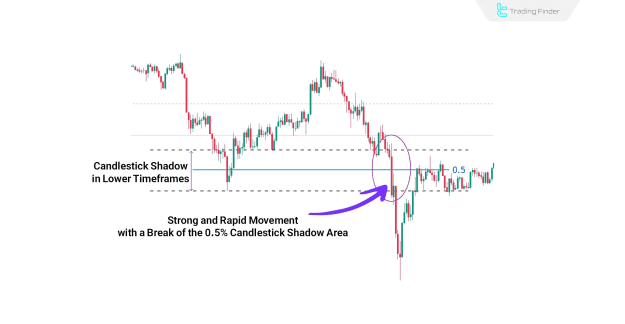
A crucial concept in ICT candlestick wick analysis is the 50% retracement level of a wick.
- Price Reaction at 50% Wick:
- If price respects the mid-wick level, it confirms continuation in the direction of the wick’s rejection.
- Example: A long lower wick followed by a bounce from the 50% level suggests bullish continuation.
- Lack of Reaction at 50% Wick:
- If price ignores the 50% level, it may indicate a structural break.
- A strong close beyond the mid-wick suggests further momentum in that direction.
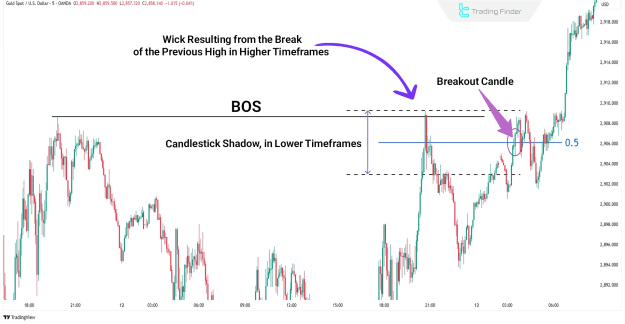
Confirmation with Break of Structure (BOS)
When trading candlestick wicks in ICT, additional confirmation is often needed:
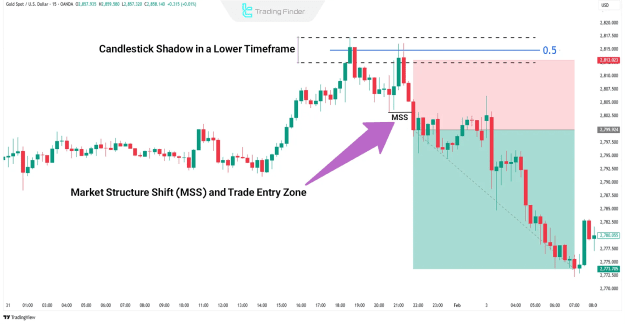
- After a reaction at the 50% wick level, watch for a Break of Structure (BOS).
- A valid BOS aligned with market flow provides a high-probability entry.
- Stop Loss (SL) should be placed beyond the recent swing high/low or a Fair Value Gap (FVG).
Candlestick Wicks as Rejection Blocks
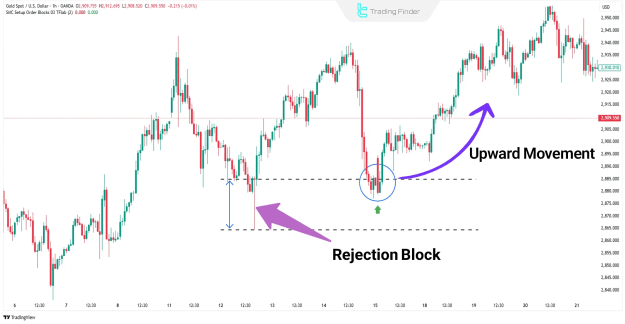
In ICT trading, long wicks often form Rejection Blocks—zones where institutional traders aggressively enter or exit.
- These blocks appear as sharp price rejections with long wicks.
- They often precede major market moves.
- Identifying them helps in spotting liquidity grabs and potential reversals.
Example of Price Reaction to a Rejection Block
- A long upper wick forms after a rally.
- Price rejects downward, confirming selling pressure.
- Traders look for short entries upon confirmation.
Key Considerations When Trading Candlestick Wicks in ICT
- Wick Length Matters
- Longer wicks indicate stronger rejections and higher significance.
- Location Within Market Structure
- Wicks at key highs/lows carry more weight than mid-trend wicks.
- Candlestick Pattern Confirmation
- Combine wick analysis with engulfing patterns, pin bars, or inside bars for stronger signals.
Conclusion
The Candlestick Wick in ICT is a powerful tool for:
- Identifying liquidity zones
- Spotting institutional order flow
- Predicting reversals & continuations