Quasimodo Pattern (QM Pattern) Indicator:
Quasimodo Pattern (QM Pattern) Indicator MT4
Quasimodo Pattern (QM Pattern) Indicator MT5
What Is the Quasimodo (QM) Pattern?
Also known as the Over and Under pattern, the Quasimodo (QM) formation consists of five critical stages that suggest a transition in market direction. It signals trend exhaustion and offers traders an early opportunity to position for a reversal.
Structure of the QM Pattern:
- Formation of an initial high (or low)
- A new low (or high), opposite to the first point
- A breakout forming a Higher High (HH) or Lower Low (LL)
- A pullback that creates a new low (or high), lower (or higher) than the previous
- Price retraces to the original level without surpassing it
The pattern becomes valid when the market fails to maintain its trend and instead respects the previous key level, indicating a potential shift in momentum.
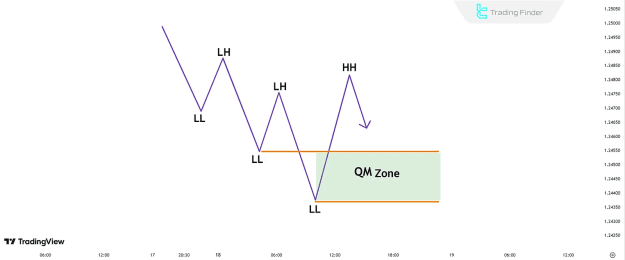
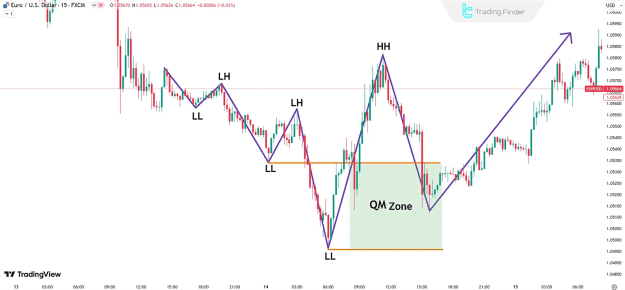
Quasimodo Pattern in a Downtrend
In a downtrend, the Quasimodo pattern may signal a bullish reversal. Traders monitor the sequence of Lower Lows (LL) and Lower Highs (LH), followed by a shift where the market forms a Higher Low, suggesting accumulation and potential upward movement.
Steps to Identify the QM Pattern.
To accurately spot the QM pattern on a chart:
- Assess the prevailing trend (uptrend or downtrend)
- Watch for structural breakouts and how price reacts at major levels
- Identify points where price revisits a previous high or low without breaching it
- Confirm the pattern with a rejection of the retracement level
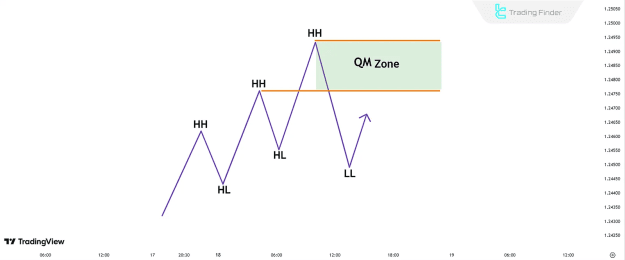
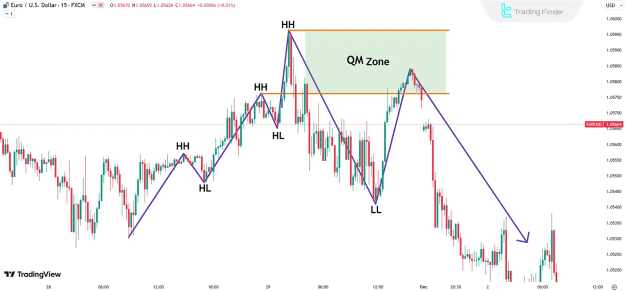
Quasimodo Pattern in an Uptrend
During an uptrend, the Quasimodo pattern indicates a possible bearish reversal. The market structure typically forms a Higher High (HH) followed by a Lower Low (LL), and then a retracement toward the HH zone. A failure to break this zone often confirms resistance and offers an ideal short entry.
How to Trade the Quasimodo (QM) Pattern
1. Identify the Market Trend
Begin by recognizing whether the trend is upward or downward.
2. Locate Key Levels
Focus on swing highs and lows where significant market reactions occurred. These form the QM zone, the critical area for entries.
3. Execute the Trade
- Sell Entry: Near the retracement to the high, if the price fails to surpass it
- Buy Entry: Near the retracement to the low, if the price fails to breach it
4. Apply Proper Risk Management
- Stop-Loss: Place above the HH for sell trades, or below the LL for buy trades
- Take-Profit: Use a favorable risk-reward ratio, typically 1:3
Practical Example of the QM Pattern
In an uptrend scenario:
- The market forms a High (H), followed by a Low (L)
- It then creates a Higher High (HH)
- The price drops to form a Lower Low (LL)
- Finally, it retraces to the original High without breaking it
At this point, a short trade can be placed, with the stop-loss above the HH.
Real Example of the QM Pattern in a Downtrend
In a bearish market, the structure unfolds in reverse:
- Multiple Lower Highs and Lower Lows form
- A Higher Low is created, and price returns to a previous level
- A bullish reversal is anticipated if the price fails to break the prior low
Key Tips for Mastering the QM Pattern
- Combine the QM setup with supply and demand zones to improve accuracy
- Avoid patterns with excessively wide highs/lows to maintain effective risk-to-reward ratios
- Use additional confirmations such as divergence, price action signals, or support/resistance validation
Conclusion
The Quasimodo (QM) pattern is a strategic price action formation within the RTM trading framework, offering traders a reliable method for spotting trend reversals. With its clear structure and ability to highlight pivotal market shifts, this pattern is a valuable component of any trader’s forex education toolkit.
It can be applied across all timeframes and asset classes, making it a versatile option for both beginners and experienced traders seeking low-risk, high-reward trading setups rooted in pure market behavior.