• Home
  • Forums
  • News
  • Calendar
  • Market
  • Login
  • Join
  • User/Email: Password:
  • 4:31am
Menu
  • Forums
  • News
  • Calendar
  • Market
  • Login
  • Join
  • 4:31am
Sister Sites
  • Energy EXCH
  • Crypto Craft
  • Forex Factory

Options

Bookmark Thread

First Page First Unread Last Page Last Post

Print Thread

Similar Threads

Let's talk about gold - XAUUSD 42 replies

XAUUSD(Gold) TradingJournal - Charts&Commentaries – by Wibie G 53 replies

5 Min Gold (XAUUSD) Divergence Strategy 176 replies

Do You Trade XAUUSD (Spot Gold)? 39 replies

XAUUSD (spot gold) update 54 replies

  • Trading Systems
  • /
  • Reply to Thread
  • Subscribe
  • 28
Attachments: Simple 5 Min Gold (XAUUSD) Strategy
Exit Attachments
Tags: Simple 5 Min Gold (XAUUSD) Strategy
Cancel

Simple 5 Min Gold (XAUUSD) Strategy

  • Last Post
  •  
  • Page 1 23 4
  • Page 1 23 4
  •  
  • Post #1
  • Quote
  • First Post: Edited May 10, 2014 3:40am May 7, 2014 7:54am | Edited May 10, 2014 3:40am
  •  rozeweb
  • | Joined Mar 2014 | Status: Member | 96 Posts
Hi, first of all I want excuse for my bad English ..

I want to share a very simple and profitable strategy. This strategy is based on Trendlines and Price Action. There are many ways to use this strategy but I will start from beginning then add more methods, filters and ideas. Everyone is welcome to polish this strategy and gain more results.

This strategy can work with any major currency pair but here I want to start with Gold (XAUUSD) due to some reasons. Gold moves 900 to 1500 pips per day. No need to run for many currency pairs. If you do analysis for 4 major currency pairs then you will need lot of time and you will get get few pips. If choose only one Gold pair then You can make more than 200 pips in single day.

Ok let's start....

How to draw a perfect trendlines?

Drawing trendlines can be very subjective and traders will draw them differently on the chart. Please first go to this thread for drawing perfect trendlines.
http://www.forexfactory.com/showthread.php?t=395428

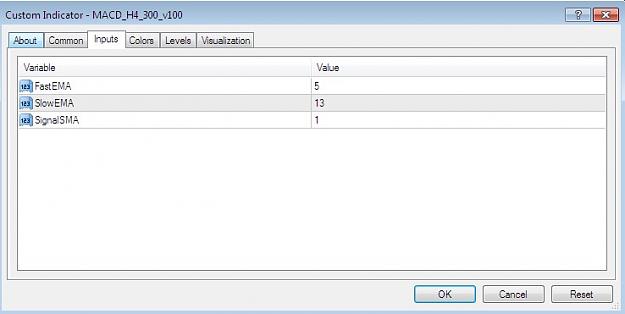
I have attached customized MACD indicator for strategy . This is not mine. I downloaded it from forexfactory and thanks for developer of this indicator.
Settings for 5 Min chart ( 1,13,1 ) Note: You can also use Default settings. It is upto you which one better work for you.
Attached Image (click to enlarge)
Click to Enlarge

Name: macd.jpg
Size: 38 KB


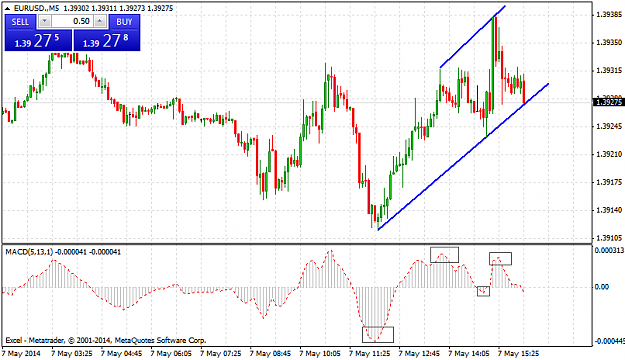
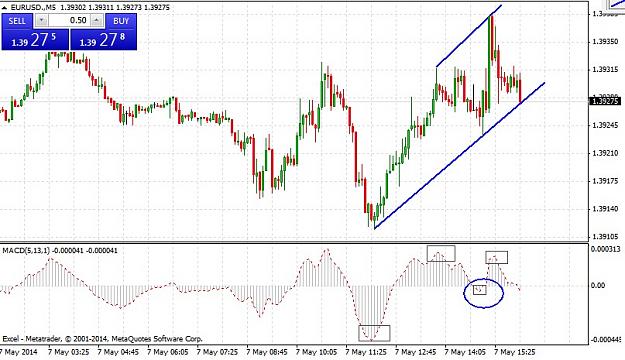
Draw trendline connecting highs and lows with the help of MACD .

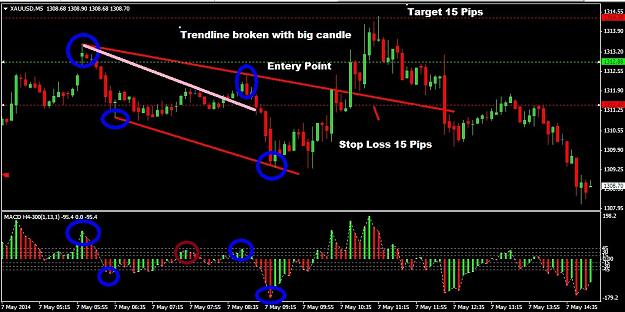
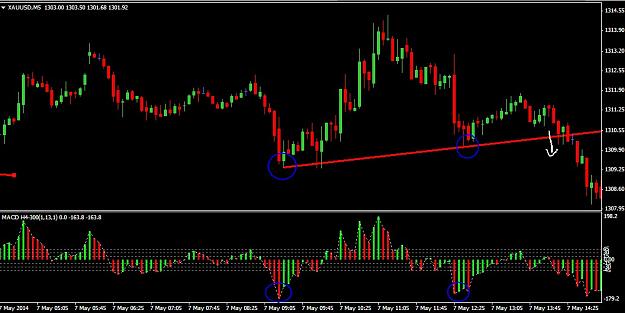
Now wait for price to break . See attach image

Attached Image (click to enlarge)
Click to Enlarge

Name: 5 min chart.jpg
Size: 118 KB


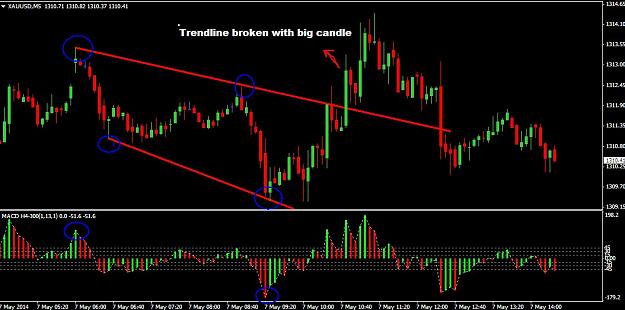
Entry: Once a big candle break the trendline. Wait for the candle to close and enter.

Stop Loss: Criteria for stopp loss is it shouldn't be less than 10 pips. It must be inside the trendline. Stop loss is based on size of breakout candle. If the size of the candle is big then stoploss can be more than 10 or 12 pips , sometimes 15 or 20 pips.

Exit: Different rules for Exit:
1. You can adjust TP for 10 pips for every trade
2. Set TP equal to Stop Loss
3. Set Tp to previous higher high or lower high
4.Set TP to next support or resistance
5. Best Exit Rule
You can make using your money management and Exit Points . For example if your SL at 15 pips and TP is also on 15 pips. Once Price reaches on target then you should close half Lot manually and move your SL at BE . Now you are free of fear. You can see many times Gold moves upto 50 to 100 pips once it breaks the trendline . It depends on you how you manage it .

Attached Image (click to enlarge)
Click to Enlarge

Name: target.jpg
Size: 139 KB


Note: This is the first step for this strategy to learn and practice. Once you will understand and comfortable then we will move to make it more advance.

I prefer this strategy on Gold because Gold move 1000 to 1500 pips in one day . So if you take only Gold and practice . Once you will able to analyse Gold movements you will be able to make more than 200 pips per day using this simple strategy . There are many benefits for Gold pair .Later I will discuss.

Please do not use it on live accounts. Practice it on Demo and manually back test. Once you will learn then discuss here your experience. So together we we will make it more advance using some other filters and best indicators. Time to time I will update this first post for easy to understand .

UPDATE

Please see my New thread about Divergence Strategy on same 5 Min Gold Chart here http://www.forexfactory.com/showthre...53#post7457653

Trendline and Divergence Both strategies are very simple and profitable. Please practice my both stratgies and then I will combine both strategies to create a very powerful complete system . I want people learn step by step especially beginners.

Please update me about your practice and ask me questions.

Thank You

Attached File(s)
File Type: mq4 MACD_H4_300_v100.mq4   3 KB | 4,629 downloads
  • Post #2
  • Quote
  • May 7, 2014 8:32am May 7, 2014 8:32am
  •  jmflukeiii
  • Joined Oct 2011 | Status: Member | 1,418 Posts
Hey objective trendlines sounds great. I'm not quite sure I understand how you are using the MACD to draw them though... could you explain that a bit more?
Small disciplines repeated with consistency lead to great achievements.
 
 
  • Post #3
  • Quote
  • May 7, 2014 8:36am May 7, 2014 8:36am
  •  rozeweb
  • | Joined Mar 2014 | Status: Member | 96 Posts
Quoting jmflukeiii
Disliked
Hey objective trendlines sounds great. I'm not quite sure I understand how you are using the MACD to draw them though... could you explain that a bit more?
Ignored
Please see this thread , this will help you to draw a trendline http://www.forexfactory.com/showthread.php?t=395428
 
 
  • Post #4
  • Quote
  • May 7, 2014 8:42am May 7, 2014 8:42am
  •  jmflukeiii
  • Joined Oct 2011 | Status: Member | 1,418 Posts
Quoting rozeweb
Disliked
{quote} Please see this thread , this will help you to draw a trendline http://www.forexfactory.com/showthread.php?t=395428
Ignored
Could you have drawn your trendline like I did in the attached picture?

EDIT: I'm not trying to be difficult, just trying to understand.

Attached Image (click to enlarge)
Click to Enlarge

Name: target 2.jpg
Size: 166 KB
Small disciplines repeated with consistency lead to great achievements.
 
 
  • Post #5
  • Quote
  • May 7, 2014 9:02am May 7, 2014 9:02am
  •  rozeweb
  • | Joined Mar 2014 | Status: Member | 96 Posts
Quoting jmflukeiii
Disliked
{quote} Could you have drawn your trendline like I did in the attached picture? EDIT: I'm not trying to be difficult, just trying to understand.
Ignored
Hi jmflukeiii

Excellent Observance, I really appreciate you . Let me explain.

You can draw this trendline but chances are less to get profit although you are getting 7 pips there . But I will not draw this trendline due to these reasons

1. Higher high or Lower high should be clear

2. Look at the candle.. those are very very small

3. There are three equal top candles which indicates something ahead like resistant or any level ( We will not trade if we see an immediate resistance or support after breakout.

4. Market has no volatility so chances are very less to get more pips.

5. This Customized MACD indicator tells lot of things , ( I will discuss later )

6 . One medium or big candle should break the trendline. These are very small candles. You can get upto 5 pips or break even .

Hope you understand some points ... Soon I will discuss more points .
 
 
  • Post #6
  • Quote
  • May 7, 2014 9:07am May 7, 2014 9:07am
  •  jmflukeiii
  • Joined Oct 2011 | Status: Member | 1,418 Posts
Thanks for the detailed response - I understand what you're saying.

I was thinking, to make it a truly mechanical process, that in order for a trendline to be valid, you could could wait for 4 MACD extremes, 2 above the 0 line and 2 below the 0 line. That way, two "macd peaks" above the line wouldn't cause a fake trendline break (at least in the example we are discussing) because you would still need the 2nd peak below the line to be created to ensure you have the correct two highs for the upper trendline. Perhaps this is cherry picking from just this one example though -


Anyway, thanks again for the response and the ideas!
Attached Image (click to enlarge)
Click to Enlarge

Name: example.png
Size: 35 KB
Small disciplines repeated with consistency lead to great achievements.
 
 
  • Post #7
  • Quote
  • May 7, 2014 9:18am May 7, 2014 9:18am
  •  rozeweb
  • | Joined Mar 2014 | Status: Member | 96 Posts
Quoting jmflukeiii
Disliked
Thanks for the detailed response - I understand what you're saying. I was thinking, to make it a truly mechanical process, that in order for a trendline to be valid, you could could wait for 4 MACD extremes,
Ignored

Thanks for your idea. You are getting the point which I wanted to explain . The rule for drawing the trendline is exact the same as you described. Thats why I gave a thread link for more explanations and ideas.

I take this snap shot . You have to connect MACD higher high above the zero line and lower lows below the zero line with price higher high and lower lows then you will find a perfect trendline .
 
 
  • Post #8
  • Quote
  • May 7, 2014 9:23am May 7, 2014 9:23am
  •  rozeweb
  • | Joined Mar 2014 | Status: Member | 96 Posts
Quoting jmflukeiii
Disliked
Thanks for the detailed response - I understand what you're saying.
Ignored
This is not a valid Support Trendline in your chart .
Attached Image (click to enlarge)
Click to Enlarge

Name: chart1.jpg
Size: 105 KB


Look at the blue circle , MACD Low is very small.. it should be clear .
 
1
  • Post #9
  • Quote
  • May 7, 2014 9:25am May 7, 2014 9:25am
  •  jmflukeiii
  • Joined Oct 2011 | Status: Member | 1,418 Posts
Quoting rozeweb
Disliked
{quote} This is not a valid Support Trendline in your chart . {image} Look at the blue circle , MACD Low is very small.. it should be clear .
Ignored
Technically speaking, I think it is, but I understand the distinction you are making - the MACD needs to make a clear and definable low/high. Perhaps you can draw a line on the MACD, a horizontal one, indicating how far the MACD must go in order to be considered valid?
Small disciplines repeated with consistency lead to great achievements.
 
 
  • Post #10
  • Quote
  • May 7, 2014 9:28am May 7, 2014 9:28am
  •  rozeweb
  • | Joined Mar 2014 | Status: Member | 96 Posts
Quoting jmflukeiii
Disliked
{quote} Technically speaking, I think it is, but I understand the distinction you are making -
Ignored
Yes if you read the thread ( http://www.forexfactory.com/showthread.php?t=395428) then you will learn quickly how to draw perfect terndline.
 
 
  • Post #11
  • Quote
  • May 7, 2014 9:31am May 7, 2014 9:31am
  •  jmflukeiii
  • Joined Oct 2011 | Status: Member | 1,418 Posts
Quoting rozeweb
Disliked
{quote} Yes if you read the thread ( http://www.forexfactory.com/showthread.php?t=395428) then you will learn quickly how to draw perfect terndline.
Ignored
Okay. I'm not convinced you need a MACD to draw trendlines, but was interested to see if drawing a trendline could be made perfectly objective. It sounds like we're close, but there are a few other subjective considerations.

How long have you been trading like this? Is it working well for you?
Small disciplines repeated with consistency lead to great achievements.
 
 
  • Post #12
  • Quote
  • May 7, 2014 9:36am May 7, 2014 9:36am
  •  rozeweb
  • | Joined Mar 2014 | Status: Member | 96 Posts
This is recent one more setup on Gold . You will get lot of setups on 5 Min chart in a single day .

Attached Image (click to enlarge)
Click to Enlarge

Name: chart2.jpg
Size: 114 KB
 
 
  • Post #13
  • Quote
  • May 7, 2014 9:40am May 7, 2014 9:40am
  •  rozeweb
  • | Joined Mar 2014 | Status: Member | 96 Posts
Quoting jmflukeiii
Disliked
{quote} Okay. I'm not convinced you need a MACD to draw trendlines, but was interested to see if drawing a trendline could be made perfectly objective. It sounds like we're close, but there are a few other subjective considerations. How long have you been trading like this? Is it working well for you?
Ignored
You can draw trendline as it suit you . I already told that is very subjective and every trader draw in different way. I just liked to draw trendline using MACD. It preserve me from many false signals.
 
 
  • Post #14
  • Quote
  • May 7, 2014 9:47am May 7, 2014 9:47am
  •  jmflukeiii
  • Joined Oct 2011 | Status: Member | 1,418 Posts
Quoting rozeweb
Disliked
{quote} You can draw trendline as it suit you . I already told that is very subjective and every trader draw in different way. I just liked to draw trendline using MACD. It preserve me from many false signals.
Ignored
No, no, sorry I didn't mean to criticize. I get it - I like it - on Ninjatrader, there is an indicator called Swing. It plots points on the chart that are the highest or lowest point of the previous X bars and the following X bars, clearly and objectively defining swing points. I use those to draw trendlines as its the exact same every time. Thanks for your ideas -
Small disciplines repeated with consistency lead to great achievements.
 
 
  • Post #15
  • Quote
  • May 7, 2014 9:55am May 7, 2014 9:55am
  •  rozeweb
  • | Joined Mar 2014 | Status: Member | 96 Posts
Quoting jmflukeiii
Disliked
{quote} No, no, sorry I didn't mean to criticize. I get it - I like it - on Ninjatrader, there is an indicator called Swing. It plots points on the chart that are the highest or lowest point of the previous X bars and the following X bars, clearly and objectively defining swing points. I use those to draw trendlines as its the exact same every time. Thanks for your ideas -
Ignored
That's great . I am looking for traders to polish this strategy for best results. You can share your Ideas freely here . No problem
 
 
  • Post #16
  • Quote
  • May 7, 2014 11:32am May 7, 2014 11:32am
  •  letterB
  • | Membership Revoked | Joined Dec 2013 | 112 Posts
Quoting rozeweb
Disliked
{quote} Hi jmflukeiii Excellent Observance, I really appreciate you . Let me explain. You can draw this trendline but chances are less to get profit although you are getting 7 pips there . But I will not draw this trendline due to these reasons 1. Higher high or Lower high should be clear 2. Look at the candle.. those are very very small 3. There are three equal top candles which indicates something ahead like resistant or any level ( We will not trade if we see an immediate resistance or support after breakout. 4. Market has no volatility so chances...
Ignored
Hi, thank you for this wonderful strategy!

My comment is regarding your example. You said under number 3: "There are three equal top candles which indicates something ahead like resistant or any level ( We will not trade if we see an immediate resistance or support after breakout"

Here is the picture, I outlined my observings in yellow colour and the comment is:

You said, we will not trade if we see an immediate resistance or support. But in you picture above an entry candle after breakout there is an immediate resistance. Look left.

http://screencast.com/t/czHH1LK2

There are three equal top candles which indicates something ahead like resistant or any level ( We will not trade if we see an immediate resistance or support after breakout.

Am I missing something?
 
 
  • Post #17
  • Quote
  • May 7, 2014 11:45am May 7, 2014 11:45am
  •  letterB
  • | Membership Revoked | Joined Dec 2013 | 112 Posts
hi, and another question:

Is this enough of close above the trendline? (I outlined with red square)

http://screencast.com/t/esEF58T6

ty
 
 
  • Post #18
  • Quote
  • May 7, 2014 11:53am May 7, 2014 11:53am
  •  letterB
  • | Membership Revoked | Joined Dec 2013 | 112 Posts
another example:

valid entry? I know there an immediate resistance on the left, but I am interested in the breakout itself. To me looks a clean entry. But probably I shouldn't take it because it's at resistance right?

http://screencast.com/t/Sbwc4B7pnV88
 
 
  • Post #19
  • Quote
  • May 7, 2014 11:58am May 7, 2014 11:58am
  •  rozeweb
  • | Joined Mar 2014 | Status: Member | 96 Posts
Quoting letterB
Disliked
{quote} Hi, thank you for this wonderful strategy! My comment is regarding your example. You said under number 3: "There are three equal top candles which indicates something ahead like resistant or any level ( We will not trade if we see an immediate resistance or support after breakout" Here is the picture, I outlined my observings in yellow colour and the comment is: You said, we will not trade if we see an immediate resistance or support. But in you picture above an entry candle after breakout there is an immediate resistance. Look left. http://screencast.com/t/czHH1LK2...
Ignored
Hi LettrB ,

First of all draw support and resistance areas then threndlines. If you see there is a strong resistance or support after trendline breakout 5 to 8 10 pips then wait for the price to break the support and resistance area too.

The image I added was a snap shot , I didn't draw support and resistance area. It was an example..

2nd I will tell you how draw support and resistance areas , which areas are important . As I mentioned I will tell many more things . Just practice it . Soon I will write more ideas.
 
 
  • Post #20
  • Quote
  • May 7, 2014 12:00pm May 7, 2014 12:00pm
  •  rozeweb
  • | Joined Mar 2014 | Status: Member | 96 Posts
Quoting letterB
Disliked
another example: valid entry? I know there an immediate resistance on the left, but I am interested in the breakout itself. To me looks a clean entry. But probably I shouldn't take it because it's at resistance right? http://screencast.com/t/Sbwc4B7pnV88
Ignored

Yes it is perfect trendline . But there is resistance.. so leave that trade
 
 
  • Trading Systems
  • /
  • Simple 5 Min Gold (XAUUSD) Strategy
  • Reply to Thread
    • Page 1 23 4
    • Page 1 23 4
1 trader viewing now
  • More
Top of Page
  • Facebook
  • Twitter
About MM
  • Mission
  • Products
  • User Guide
  • Blog
  • Contact
MM Products
  • Forums
  • Calendar
  • News
  • Market
MM Website
  • Homepage
  • Search
  • Members
  • Report a Bug
Follow MM
  • Facebook
  • Twitter

MM Sister Sites:

  • Energy EXCH
  • Crypto Craft
  • Forex Factory

Metals Mine™ is a brand of Fair Economy, Inc.

Terms of Service / ©2023