For the records, I wasn't taught this system by one single individual. It is a combination of so many information from different sources. Whatever works, you will thank me later.
(And I must say, the achievement of FXSayWhat in turning 10usd to more than 1000usd spurred my further researches)
Alright, first you have to know the following concepts.
1. Impulse wave and impulse candles.
2. Stop loss, limit order, stop order
3. Chart patterns
4. Candlestick formation.
5. Money management
Things you need to trade this simple but tasking system are
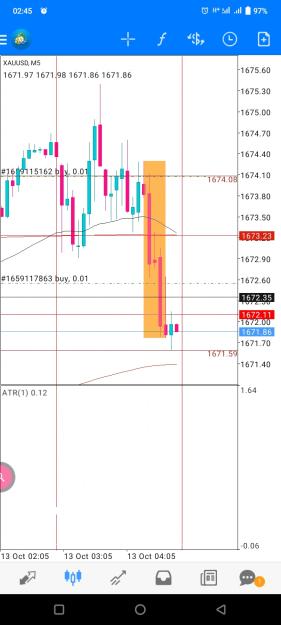
1. Cycle Lines to divide your M5 chart into twelve equal sessions. Each session having 24 candles.
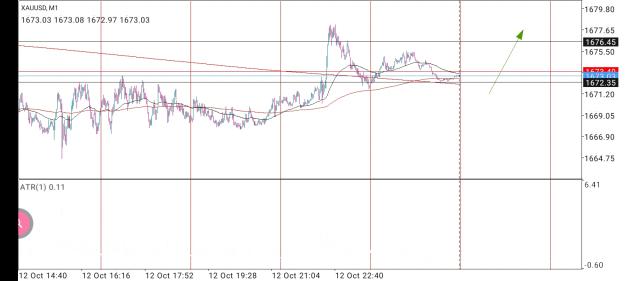
2. Bollinger Bands set to 4000, or SMA set to 4000 on M1. This is for directional bias or trend.
3. Horizontal lines.
4. A good pivot calculator for fast calculation.
I am telling you, you will never be caught unawares again by the market.
Explanation
1. On your M5 chart, say first session find the longest impulse wave. All must be same color or candles.
2. Detect the longest impulse candle in that longest impulse wave.
3. Calculate the pivot of that longest impulse candle. And plot it using a horizontal line.
4. What is 4000 Bollinger Band saying?
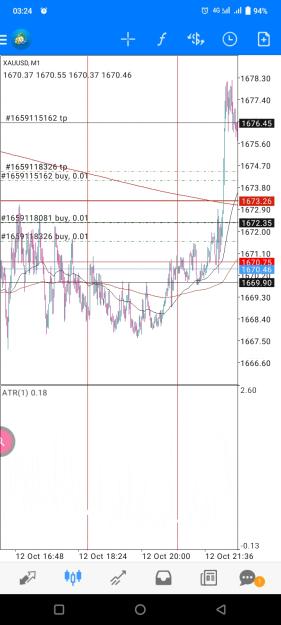
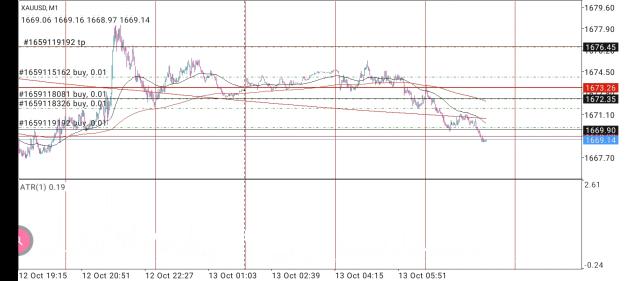
5. Trade in that direction of 4000 on M1. If price is above, you are buying, if below, you are selling. Using Limit orders only.
6. Stop loss previous session's low or high, depending on whether you are buying or selling.
That's it man.! Whatever works!
Thank me forever.
(And I must say, the achievement of FXSayWhat in turning 10usd to more than 1000usd spurred my further researches)
Alright, first you have to know the following concepts.
1. Impulse wave and impulse candles.
2. Stop loss, limit order, stop order
3. Chart patterns
4. Candlestick formation.
5. Money management
Things you need to trade this simple but tasking system are
1. Cycle Lines to divide your M5 chart into twelve equal sessions. Each session having 24 candles.
2. Bollinger Bands set to 4000, or SMA set to 4000 on M1. This is for directional bias or trend.
3. Horizontal lines.
4. A good pivot calculator for fast calculation.
I am telling you, you will never be caught unawares again by the market.
Explanation
1. On your M5 chart, say first session find the longest impulse wave. All must be same color or candles.
2. Detect the longest impulse candle in that longest impulse wave.
3. Calculate the pivot of that longest impulse candle. And plot it using a horizontal line.
4. What is 4000 Bollinger Band saying?
5. Trade in that direction of 4000 on M1. If price is above, you are buying, if below, you are selling. Using Limit orders only.
6. Stop loss previous session's low or high, depending on whether you are buying or selling.
That's it man.! Whatever works!
Thank me forever.
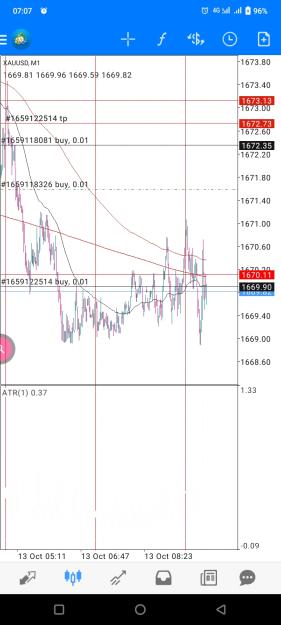
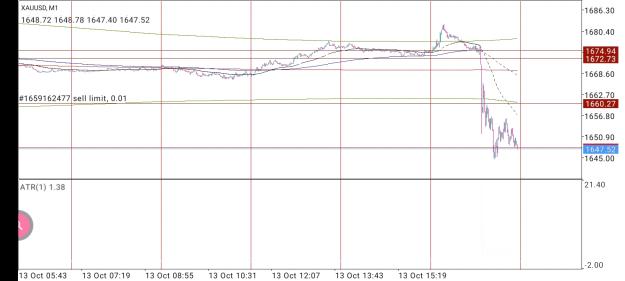
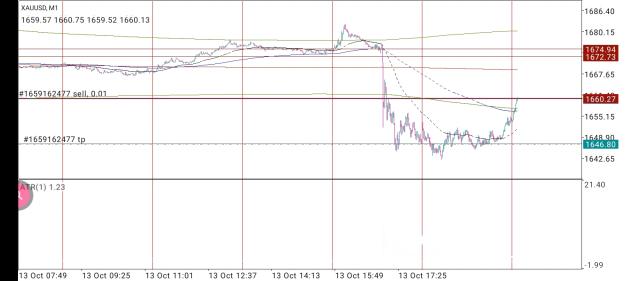
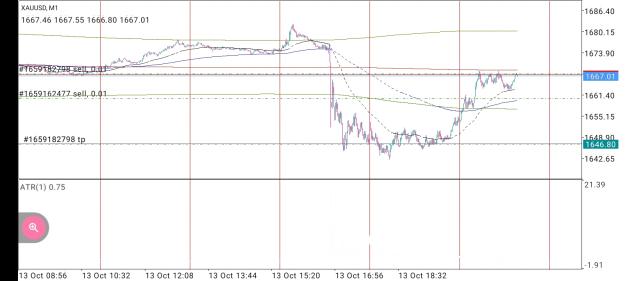
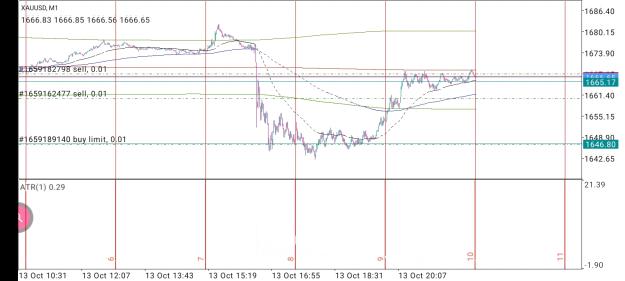
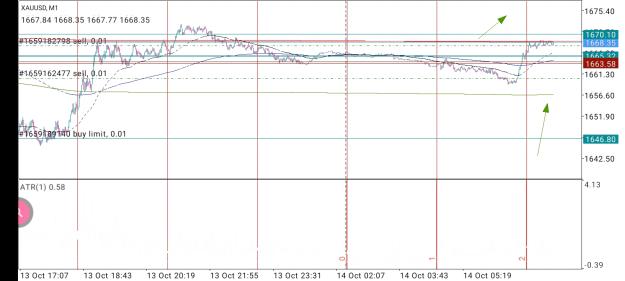
Attached File(s)
Learn... Work Hard... Trade Alone