PRICE ACTION. COMPRESSION SPANSION AND THE 1-2-3
Hello everyone. My purpose with this thread is to remember once again that there is no more accurate indicator than the same PRICE ACTION.
There are patterns of candles such as double-roof, triple-roof, shoulder-head and other more that help identify a depletion of the current trend and the beginning of a new trend.
It is clear that to find a trend change, the current price chart must be trend, otherwise there would be a change in trend.
For this type of analysis we will only use support and resistance lines and trend lines.
Operating times: All deadlines. Particularly I use high deadlines (day), for my work schedule in Colombia.
Bullish trend: It is understood that the price is in uptrend, when the maxima that are being formed are higher than the previous maximum, just as the new minima are higher than the previous minimum.
Sales Operations:
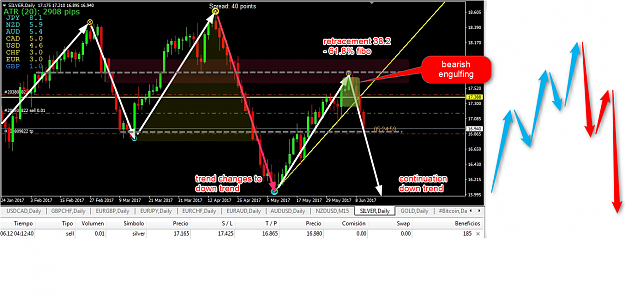
1. There is depletion of the bullish wave; This is shown when the price goes back and in the attempt to keep going up, the price does not exceed the last highest candle and may be forming the double ceiling pattern.
2. Breakdown of the last support: It is shown when the price when not breaking the last resistance, it recovers and breaks the last support, reason why it is forming signs of change of tendency.
3. Breaking the trend line: When the price does step 2, it usually reaches to break the trend line up, and is expected to change the trend.
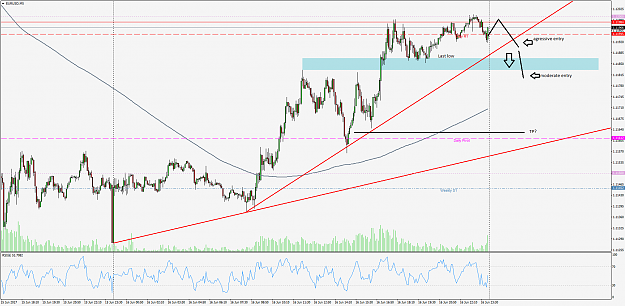
4. Aggressive Entry: This occurs when once the price breaks the last line of support and trend, it is expected to close the candle and open the sale operation at the beginning of the next candle.
5. Moderate entry: This occurs when the price breaks the last support and the bullish trend line, It is expected to move back towards the resistance zone before support zone, and once the price shows the first bear candle, one enters In the sale operation.
Purchase Operations: the opposite of the Sale operations.
I hope that people who work in this type of trade, contribute by contributing knowledge to improve the percentage of benefits, which as we all know, requires a good analysis before entering the market.
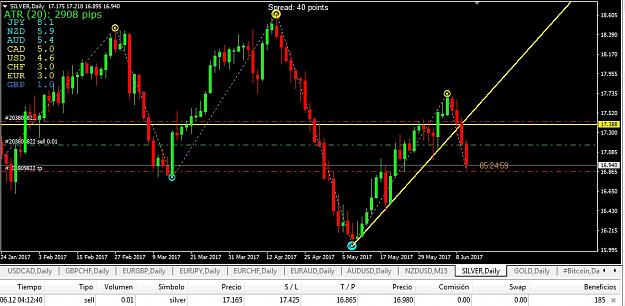
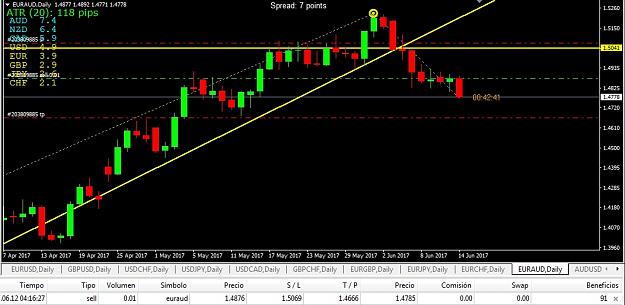
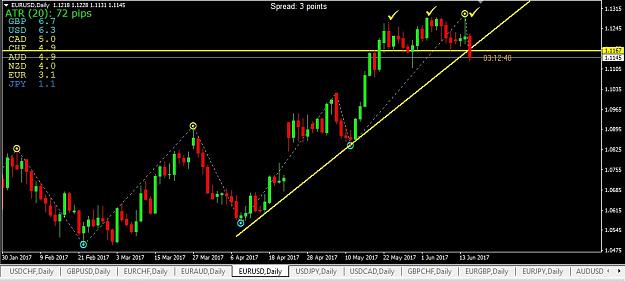
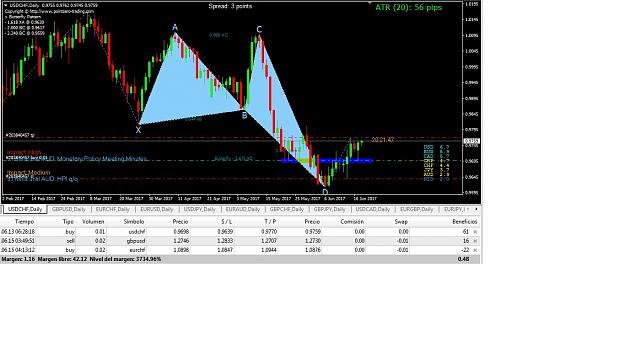
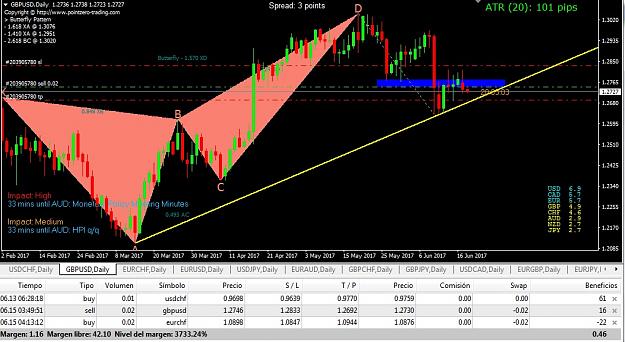
Excuse my bad English, for not being my mother tongue. As a picture says more than a thousand words, I enclose one of the latest sales transactions made, in a day time frame.
Hello everyone. My purpose with this thread is to remember once again that there is no more accurate indicator than the same PRICE ACTION.
There are patterns of candles such as double-roof, triple-roof, shoulder-head and other more that help identify a depletion of the current trend and the beginning of a new trend.
It is clear that to find a trend change, the current price chart must be trend, otherwise there would be a change in trend.
For this type of analysis we will only use support and resistance lines and trend lines.
Operating times: All deadlines. Particularly I use high deadlines (day), for my work schedule in Colombia.
Bullish trend: It is understood that the price is in uptrend, when the maxima that are being formed are higher than the previous maximum, just as the new minima are higher than the previous minimum.
Sales Operations:
1. There is depletion of the bullish wave; This is shown when the price goes back and in the attempt to keep going up, the price does not exceed the last highest candle and may be forming the double ceiling pattern.
2. Breakdown of the last support: It is shown when the price when not breaking the last resistance, it recovers and breaks the last support, reason why it is forming signs of change of tendency.
3. Breaking the trend line: When the price does step 2, it usually reaches to break the trend line up, and is expected to change the trend.
4. Aggressive Entry: This occurs when once the price breaks the last line of support and trend, it is expected to close the candle and open the sale operation at the beginning of the next candle.
5. Moderate entry: This occurs when the price breaks the last support and the bullish trend line, It is expected to move back towards the resistance zone before support zone, and once the price shows the first bear candle, one enters In the sale operation.
Purchase Operations: the opposite of the Sale operations.
I hope that people who work in this type of trade, contribute by contributing knowledge to improve the percentage of benefits, which as we all know, requires a good analysis before entering the market.
Excuse my bad English, for not being my mother tongue. As a picture says more than a thousand words, I enclose one of the latest sales transactions made, in a day time frame.
Attached Image (click to enlarge)