So I was thinking that if we could apply the same techniques of analyzing price charts on forex to fundamental data. For example, you apply the moving average on the monthly unemployment report for the past few years on a country? Do you think that the same rules of forex analysis applies here?
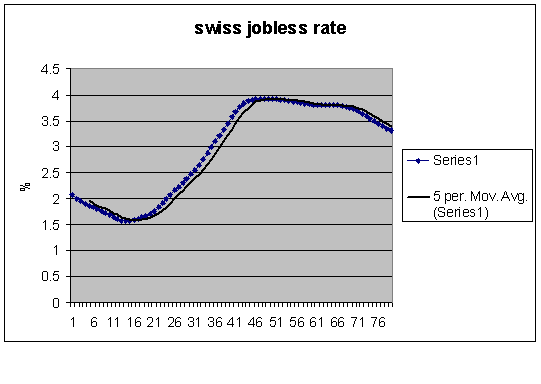
I have attached monthly unemployment rate of switzerland since January 2000 obtained from the Bank of Switzerland's website. I transfered the data to excel and plot the moving average (5 period) trendline on it.
So I assume that the unemployement report tomorrow will decrease again since it has been below the moving average for a few months.
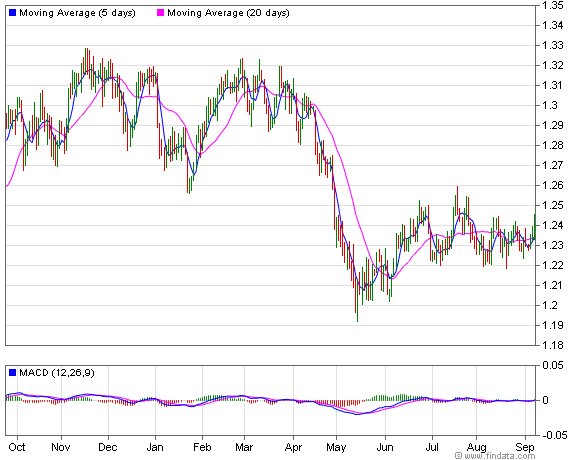
Even if I am wrong, at least I have something to back it up. Waht do you think? short usd/chf now?
I have attached monthly unemployment rate of switzerland since January 2000 obtained from the Bank of Switzerland's website. I transfered the data to excel and plot the moving average (5 period) trendline on it.
So I assume that the unemployement report tomorrow will decrease again since it has been below the moving average for a few months.
Even if I am wrong, at least I have something to back it up. Waht do you think? short usd/chf now?
Attached Image

Working towards CME membership