This system is by Noorx.It's win ratio is amazing almost 100%.But unfortunately he has deleted his thread and discontinued all his thread updates.So i am continuing this thread.
Broker Time:GMT+2
Indicator:RSI(14)-Level(30/70)
Pair:mostly EURUSD
We must use have M1 chart in your pair (EURUSD) the RSI indicator to spot market movements from a specific time period, which will lead to identification of whether you should go LONG (buy) or go SHORT (sell) market.
This strategy may ONLY work on events such as Non Farm Payroll, FOMC Minutes and meetings and other highly recognized economic important events, and currency pair EURUSD since it is the most stable.
Steps:
1. Turn to 1M chat
2. Set RSI(14) Level(30/70)
3. Start watching the chart 2 hours into the Big News event and pay attention to RSI
- If RSI’s last cross was 70, then take Long trade once news comes out (If didn't reach 1.40 hours trade same direction)
- If RSI’s last cross was 30, then take Short trade once news comes out (If didn't reach 1.40 hours trade same direction)
- If RSI’s last break out happened more than 2 hours ago, then take opposite trade once news comes out.
In another word:
We take Short trades if M1 RSI(14) crossed 70 and doesn't cross 30 after 1.40 hours
We take Long trades if M1 RSI (14) crossed 30 and doesn't cross 70 after 1.40 hours
If chart crossed 70 on M1 and didn't reach 1.40 hours, then it indicates we need to go Long, and vice versa with Short as well.
For example, when M1 chart passes 70 on RSI, which basically means ''breakout'', either we wait for 2 hours to turn Short or we go Long when it has not passed 1.40 minutes. On today's NFP, it didn't pass 1.23 hours, therefore we went Long.
It happens vice versa when Shorting and when it breaks out farther from 30 on the RSI as well.
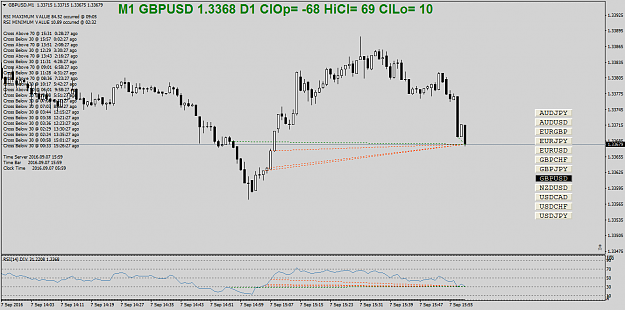
TRADING FOMC
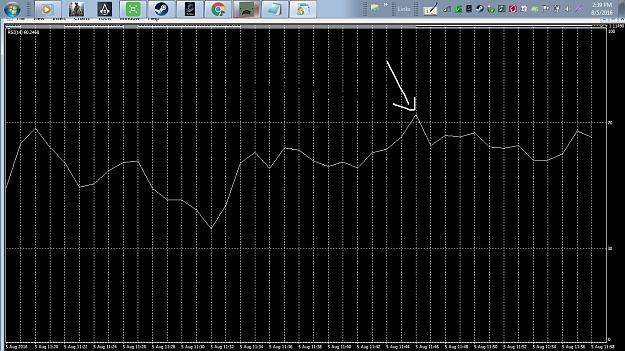
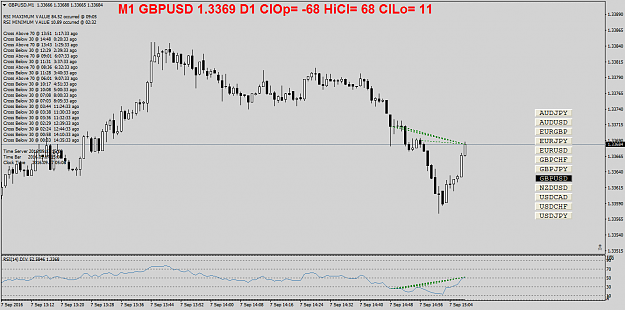
In the above picture it shows that the line broke out with LONG (BUY) on 12:28, HENCE the market has only 1.3 or 1.4 hours to go LONG if an event arrived at that time, if it passed more than the given time (which is 1 hour and 40 minutes) it INDICATES that you need to go SHORT (SELL) but since FOMC is on 21:00 (GMT 2-), I can't tell yet.
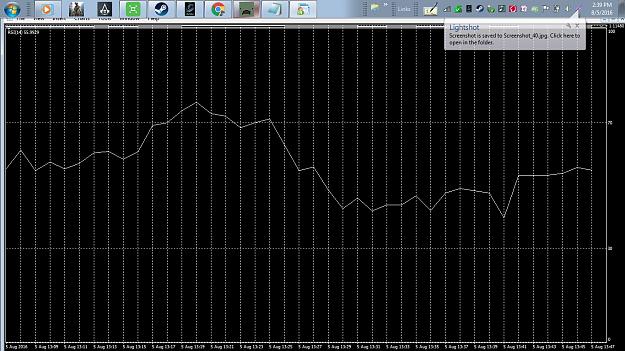
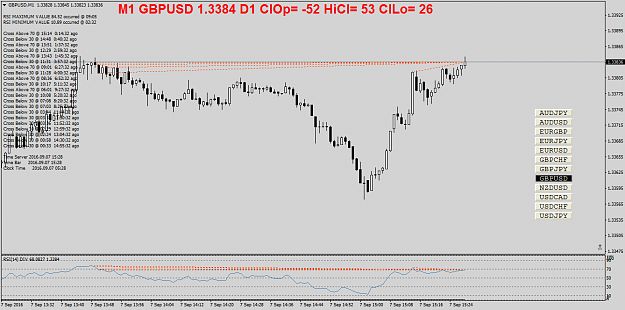
On 15:28, it went SHORT (SELL), meaning it has room to go SHORT for 1.4 or 1.3 hours.
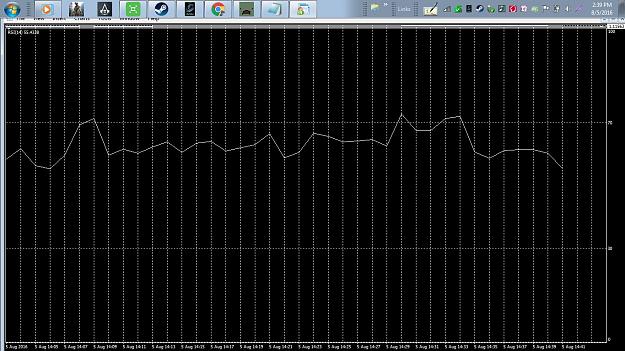
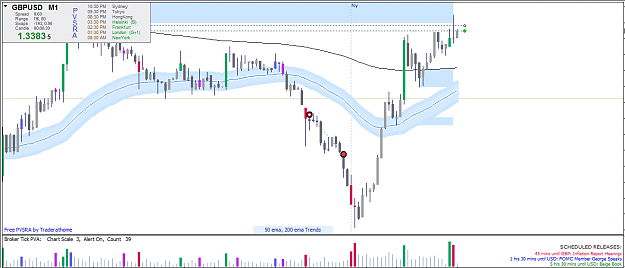
On 17:26 it went LONG again. It kept on going LONG for more than 2 hours, meaning it will GO SHORT on the FOMC Minutes as shown below!
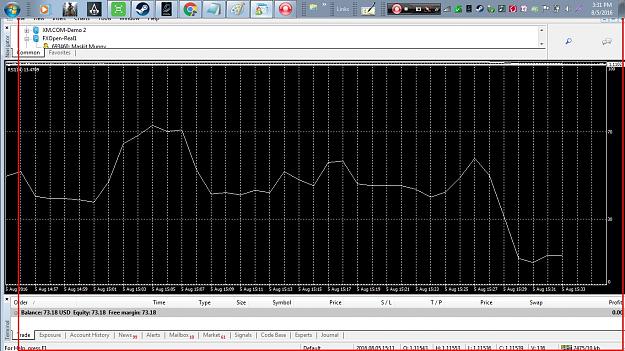
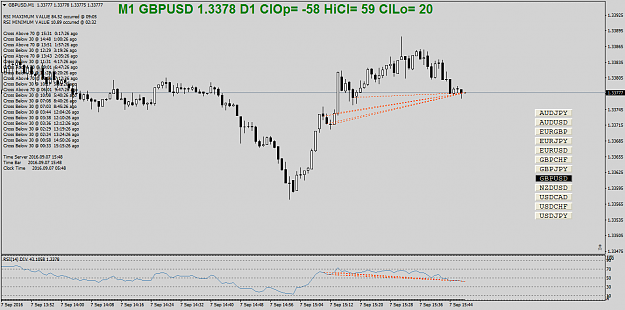
On 21:00 (2:00 PM) it went SHORT and fell almost 65 pips! Sadly, I can't predict the market so my only aim was to set my TP on 16 pips.
Broker Time:GMT+2
Indicator:RSI(14)-Level(30/70)
Pair:mostly EURUSD
We must use have M1 chart in your pair (EURUSD) the RSI indicator to spot market movements from a specific time period, which will lead to identification of whether you should go LONG (buy) or go SHORT (sell) market.
This strategy may ONLY work on events such as Non Farm Payroll, FOMC Minutes and meetings and other highly recognized economic important events, and currency pair EURUSD since it is the most stable.
Steps:
1. Turn to 1M chat
2. Set RSI(14) Level(30/70)
3. Start watching the chart 2 hours into the Big News event and pay attention to RSI
- If RSI’s last cross was 70, then take Long trade once news comes out (If didn't reach 1.40 hours trade same direction)
- If RSI’s last cross was 30, then take Short trade once news comes out (If didn't reach 1.40 hours trade same direction)
- If RSI’s last break out happened more than 2 hours ago, then take opposite trade once news comes out.
In another word:
We take Short trades if M1 RSI(14) crossed 70 and doesn't cross 30 after 1.40 hours
We take Long trades if M1 RSI (14) crossed 30 and doesn't cross 70 after 1.40 hours
If chart crossed 70 on M1 and didn't reach 1.40 hours, then it indicates we need to go Long, and vice versa with Short as well.
For example, when M1 chart passes 70 on RSI, which basically means ''breakout'', either we wait for 2 hours to turn Short or we go Long when it has not passed 1.40 minutes. On today's NFP, it didn't pass 1.23 hours, therefore we went Long.
It happens vice versa when Shorting and when it breaks out farther from 30 on the RSI as well.
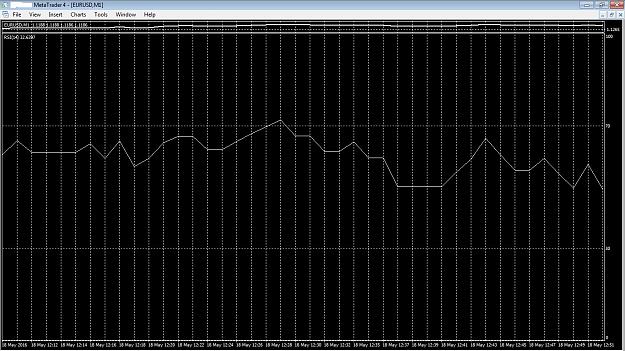
TRADING FOMC
Attached Image (click to enlarge)
In the above picture it shows that the line broke out with LONG (BUY) on 12:28, HENCE the market has only 1.3 or 1.4 hours to go LONG if an event arrived at that time, if it passed more than the given time (which is 1 hour and 40 minutes) it INDICATES that you need to go SHORT (SELL) but since FOMC is on 21:00 (GMT 2-), I can't tell yet.
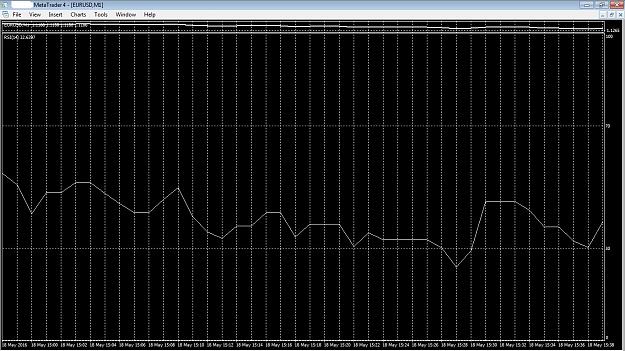
On 15:28, it went SHORT (SELL), meaning it has room to go SHORT for 1.4 or 1.3 hours.
Attached Image (click to enlarge)
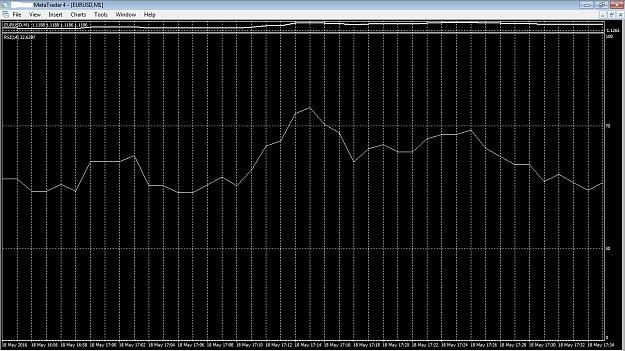
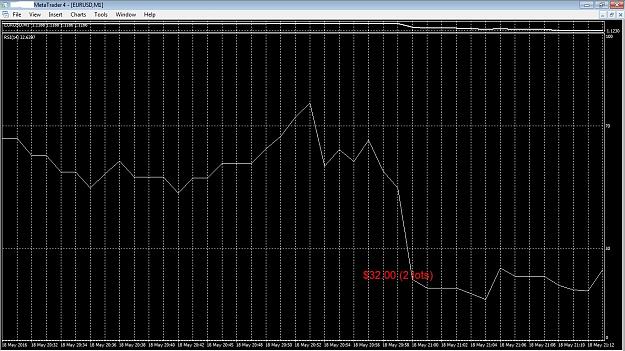
On 17:26 it went LONG again. It kept on going LONG for more than 2 hours, meaning it will GO SHORT on the FOMC Minutes as shown below!
Attached Image (click to enlarge)
On 21:00 (2:00 PM) it went SHORT and fell almost 65 pips! Sadly, I can't predict the market so my only aim was to set my TP on 16 pips.
Attached Image (click to enlarge)