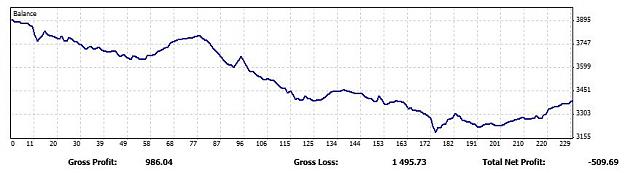
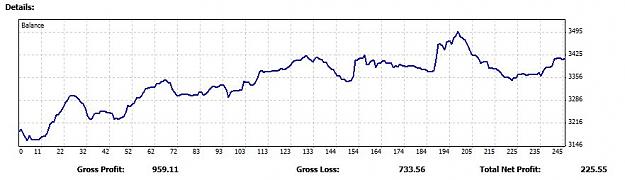
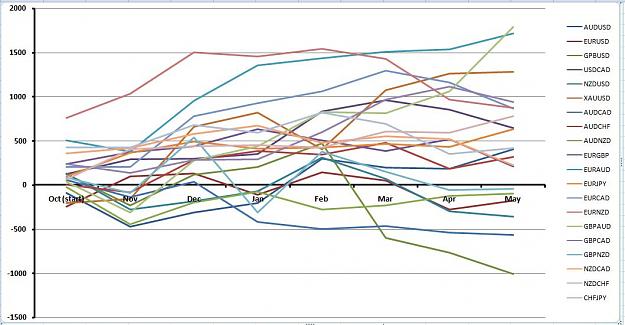
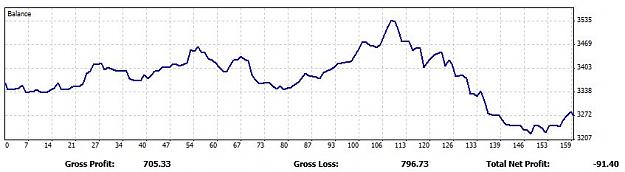
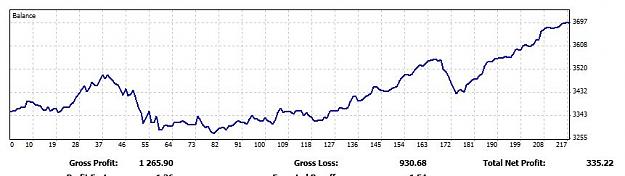
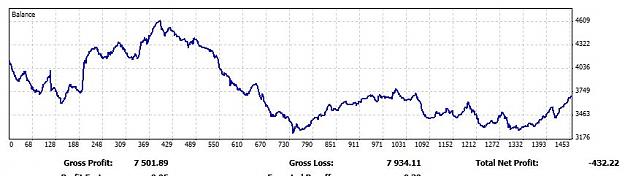
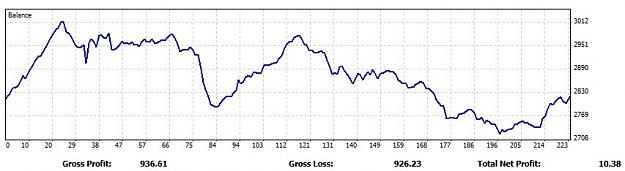
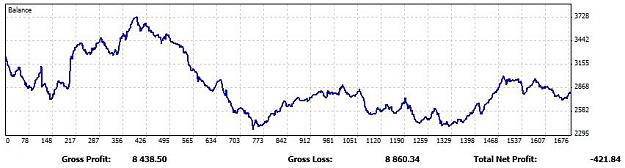
DislikedHi all Here are the results for January and also including Oct. Nov. and Dec. again. Each month has a hand written page of every traded pair with every trade taken for that month and also a small summary at the bottom of page. {image} {image} {image} {image} Here is the graph {image} Finally here is an excel report of each pairs monthly result and each months result and a final result for all 4 months. {file} I am going to take this live in February and see how it goes...stay tuned. ChrisIgnored
I'm trying to fully understand how you trade and the results you have. So I used Jan 2016 as an example and went through the USD/JPY pair.... candle by candle so I'd like your input to ensure I've got it right.
From what I've worked out for that pair for that month was:
Attached Image (click to enlarge)
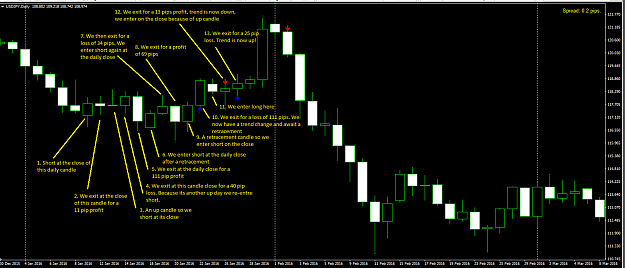
+11-40+111-34+69-111+13-25 = -6 pips (PLEASE NOTE SPREADS ARE NOT INCLUDED, this is a visual back test)
Compared for your calculations on your Jan 2016 statement you have a loss of 48 pips, so I'm scratching my heads to see where I've gone wrong!
Cheers
Serj