ALWAYS START TRENDING FROM M1 PERIOD
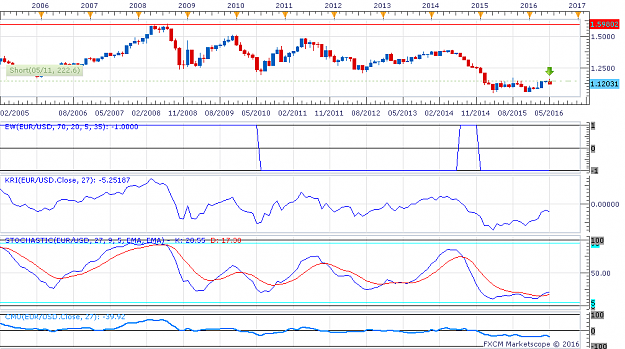
The overbought line is a resistance line, and it is hard to say whether or not the market price will break through it or tumble down. I have observed that whenever the M1 chart hits overbought (by market makers) line, the instrument (forex pair or stock), if it is reversing trend, it progressively declines in value from M1 through W1, D1 and H4 - see full stochastic in the charts below.
Conversely whenever the M1 chart hits the oversold (by market makers) line, if it will reverse trend, it shows a progressive increase in in price from M1 through through W1, D1, and H4 In effect, the rule of thumb: buy at low and sell at high is still very relevant. If your current monthly candle stick is green and overbought, the trade direction should be short, if if there is progressive det rending from M1 to H4.
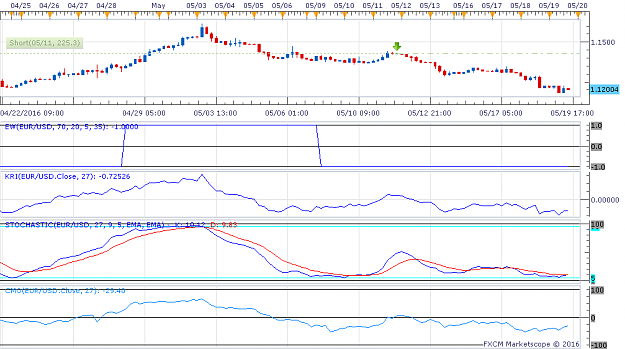
If the price is holding steary across these periods, it is most likely to break though the resistance and continue an upward trend. This is one of the times I activate a double volume stop loss tool until I am sure which way it is going. This means that I set up an opposite trade with a stop limit at the overbought price, with double the current pair volume. Verify this by checking the M1, W1, D1, and H4 charts. The H4 period value is often at the opposite pole across the zero line from M1 period value. The price oscillator should be agreeable with this observed direction.
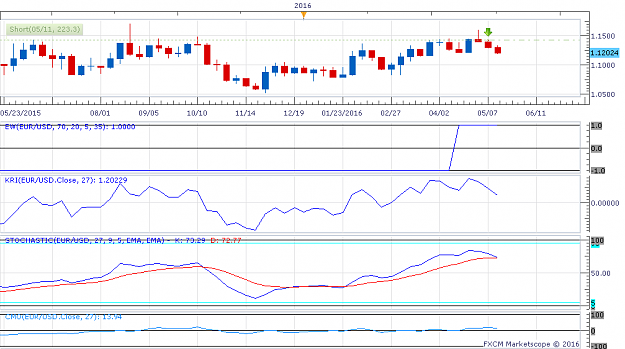
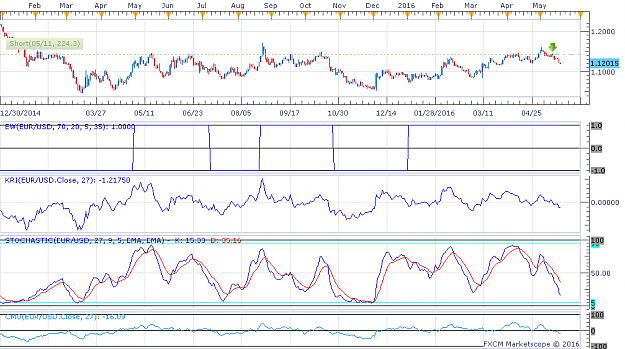
Next thing, you check is to ensure that the momentum and market volatility are trending in the same direction using CMO, EW, KRI and MESA Sine Wave. If they all line up you fee safe to lock in a trade and go from there. See the charts below for confirmation of my observations (Top chart = M1, 2nd chart = W1, 3rd chart = D1 and button chart = H4)
The overbought line is a resistance line, and it is hard to say whether or not the market price will break through it or tumble down. I have observed that whenever the M1 chart hits overbought (by market makers) line, the instrument (forex pair or stock), if it is reversing trend, it progressively declines in value from M1 through W1, D1 and H4 - see full stochastic in the charts below.
Conversely whenever the M1 chart hits the oversold (by market makers) line, if it will reverse trend, it shows a progressive increase in in price from M1 through through W1, D1, and H4 In effect, the rule of thumb: buy at low and sell at high is still very relevant. If your current monthly candle stick is green and overbought, the trade direction should be short, if if there is progressive det rending from M1 to H4.
If the price is holding steary across these periods, it is most likely to break though the resistance and continue an upward trend. This is one of the times I activate a double volume stop loss tool until I am sure which way it is going. This means that I set up an opposite trade with a stop limit at the overbought price, with double the current pair volume. Verify this by checking the M1, W1, D1, and H4 charts. The H4 period value is often at the opposite pole across the zero line from M1 period value. The price oscillator should be agreeable with this observed direction.
Next thing, you check is to ensure that the momentum and market volatility are trending in the same direction using CMO, EW, KRI and MESA Sine Wave. If they all line up you fee safe to lock in a trade and go from there. See the charts below for confirmation of my observations (Top chart = M1, 2nd chart = W1, 3rd chart = D1 and button chart = H4)
Attached Image(s) (click to enlarge)
Mecrandie