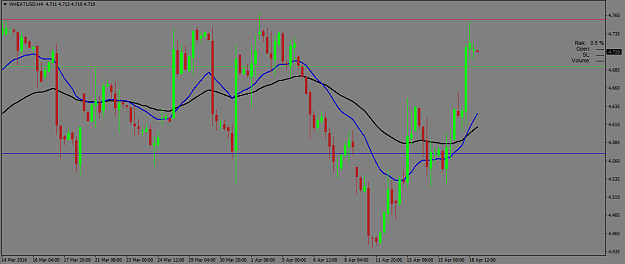
If you aren't familiar with Triple Screen Trading, it is a basic technical trend following strategy involving three timeframes:
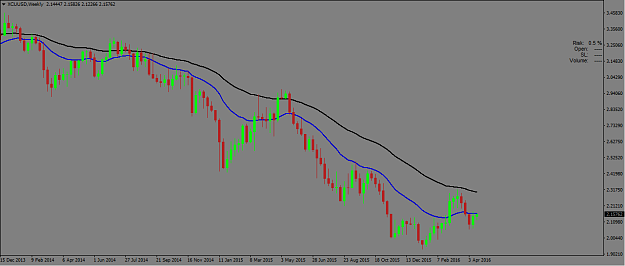
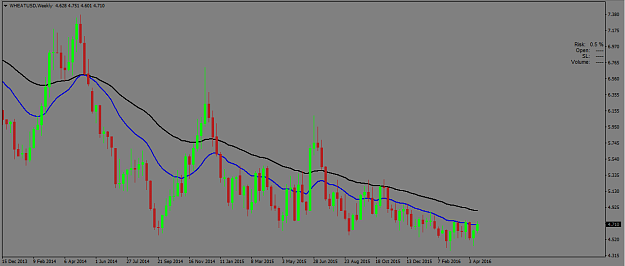
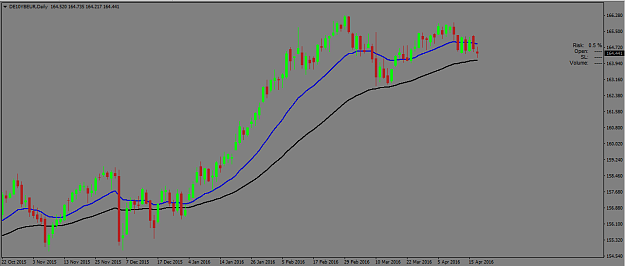
- Wait for a trend to develop on the highest timeframe.
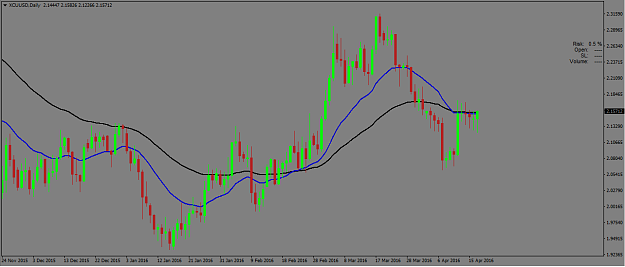
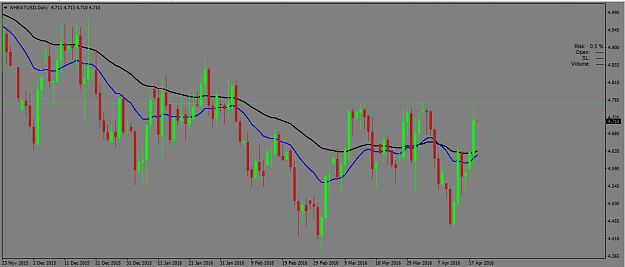
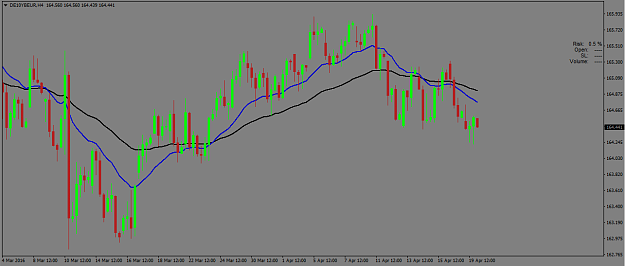
- Drop to the second timefame and wait for a pullback against that trend.
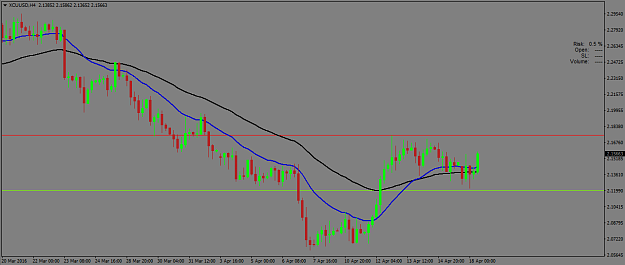
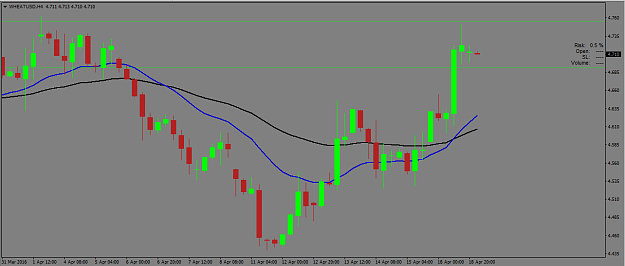
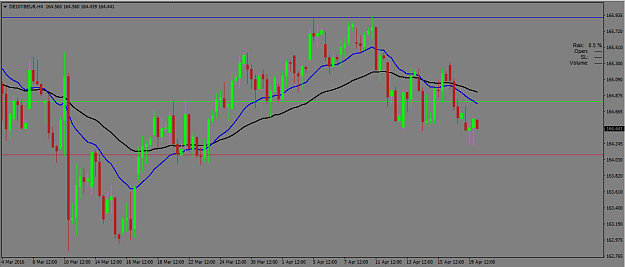
- Drop to the lowest timeframe and enter when price turns back in the direction of the larger trend.
This is a fundamental analysis-based variation of Triple Screen Trading.
The setup ... I don't start looking for a trade until these three conditions are met:
1. The weekly chart is indicating that a trend is in place.
2. The daily chart shows a pullback against that trend
3. The fundamental reason for the weekly trend is still there, meaning the trend is likely to continue.
Only when these three things are in place, I drop to the 4H charts and enter if/when price breaks back in the direction of the weekly trend.
---------------------------------------------------------------------------------------------------------------------------------------------------------------------
Fundamental analysis can be intimidating and overwhelming if you try to do it all yourself. There is a massive amount of information coming from every country every day ... economic data, trade conditions, local and international political concerns, changing fiscal policies etc ... it's far too much for any one trader to analyze and use. Luckily we have teams of highly educated economists in each country, absorbing all this information, analyzing it for us, and boiling it all down into simple summaries we can use. They are called central banks .... and while they aren't perfect, following the direction they provide will put us on the correct side of all of that information more often than not. If you don't trust central banks, or if you buy into the conspiracy theories about them, just try to do all that work yourself. I dare you.
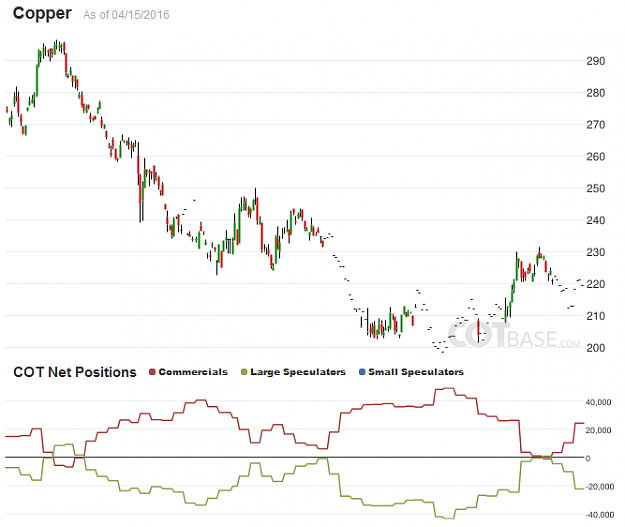
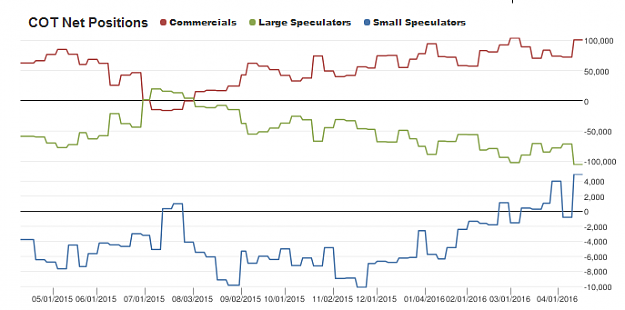
In the commodity markets, COT data serves a similar purpose. COT positioning represents teams of the sharpest minds in the business, who spend their days absorbing and analyzing every available piece of information about every tradeable commodity. Trading in the same direction as them should put us, more often than not, on the correct side of that mass of information.
I think it's pretty cool that these two tools are available to us as traders. When you think about how much information is being collected on our behalf, analyzed and condensed into such an easy and useful format, by teams of people much smarter and more experienced than ourselves, it seems silly not to take advantage of it.
I've simplified things here ... there is a lot of nuance and discretion involved in my analysis which I'll get into later but my basic FA rules are:
- Only buy a currency if the central bank is hawkish/becoming hawkish.
- Only sell a currency if the central bank is dovish/becoming dovish.
- Only buy stock indices if all major central banks are simultaneously dovish.
- Only sell stock indices if all major central banks are simultaneously hawkish.
- Only buy a commodity if COT shows large speculators are buying.
- Only sell a commodity if COT show large speculators are selling.
---------------------------------------------------------------------------------------------------------------------------------------------------------------------
I only trade Weekly/Daily/4H charts .... if you want to use different timeframes, please do it somewhere else. If you are combining FA with TA, one of the most important things is that the different components of your strategy are unfolding over the same time period. This sounds obvious, but it took me a long time to figure out and master this basic idea. If you think you have a handle on the fundamentals, the first question to ask yourself is how often do the fundamentals change? If you are trading reactions to intraday news releases the fundamentals are changing several times a day, so you need a technical system which gets you in and out of the market (on average) in a few hours.
Since I am trading longer term themes such as central bank sentiment, which maybe change once or twice a month, I try to get in and out of the market (on average) in a few weeks .... so lower timeframes simply don't work with this strategy.
- Wait for a trend to develop on the highest timeframe.
- Drop to the second timefame and wait for a pullback against that trend.
- Drop to the lowest timeframe and enter when price turns back in the direction of the larger trend.
This is a fundamental analysis-based variation of Triple Screen Trading.
The setup ... I don't start looking for a trade until these three conditions are met:
1. The weekly chart is indicating that a trend is in place.
2. The daily chart shows a pullback against that trend
3. The fundamental reason for the weekly trend is still there, meaning the trend is likely to continue.
Only when these three things are in place, I drop to the 4H charts and enter if/when price breaks back in the direction of the weekly trend.
---------------------------------------------------------------------------------------------------------------------------------------------------------------------
Fundamental analysis can be intimidating and overwhelming if you try to do it all yourself. There is a massive amount of information coming from every country every day ... economic data, trade conditions, local and international political concerns, changing fiscal policies etc ... it's far too much for any one trader to analyze and use. Luckily we have teams of highly educated economists in each country, absorbing all this information, analyzing it for us, and boiling it all down into simple summaries we can use. They are called central banks .... and while they aren't perfect, following the direction they provide will put us on the correct side of all of that information more often than not. If you don't trust central banks, or if you buy into the conspiracy theories about them, just try to do all that work yourself. I dare you.
In the commodity markets, COT data serves a similar purpose. COT positioning represents teams of the sharpest minds in the business, who spend their days absorbing and analyzing every available piece of information about every tradeable commodity. Trading in the same direction as them should put us, more often than not, on the correct side of that mass of information.
I think it's pretty cool that these two tools are available to us as traders. When you think about how much information is being collected on our behalf, analyzed and condensed into such an easy and useful format, by teams of people much smarter and more experienced than ourselves, it seems silly not to take advantage of it.
I've simplified things here ... there is a lot of nuance and discretion involved in my analysis which I'll get into later but my basic FA rules are:
- Only buy a currency if the central bank is hawkish/becoming hawkish.
- Only sell a currency if the central bank is dovish/becoming dovish.
- Only buy stock indices if all major central banks are simultaneously dovish.
- Only sell stock indices if all major central banks are simultaneously hawkish.
- Only buy a commodity if COT shows large speculators are buying.
- Only sell a commodity if COT show large speculators are selling.
---------------------------------------------------------------------------------------------------------------------------------------------------------------------
I only trade Weekly/Daily/4H charts .... if you want to use different timeframes, please do it somewhere else. If you are combining FA with TA, one of the most important things is that the different components of your strategy are unfolding over the same time period. This sounds obvious, but it took me a long time to figure out and master this basic idea. If you think you have a handle on the fundamentals, the first question to ask yourself is how often do the fundamentals change? If you are trading reactions to intraday news releases the fundamentals are changing several times a day, so you need a technical system which gets you in and out of the market (on average) in a few hours.
Since I am trading longer term themes such as central bank sentiment, which maybe change once or twice a month, I try to get in and out of the market (on average) in a few weeks .... so lower timeframes simply don't work with this strategy.
si hoc legere scis nimium eruditionis habes