Hello guys!
Could anyone please help me to write code for an indicator that showing previous Weekly and Monthly High Low by drawing simple horizontal lines (not Highest and Lowest) or tell me the thread that already shared indicator like this. Here for example
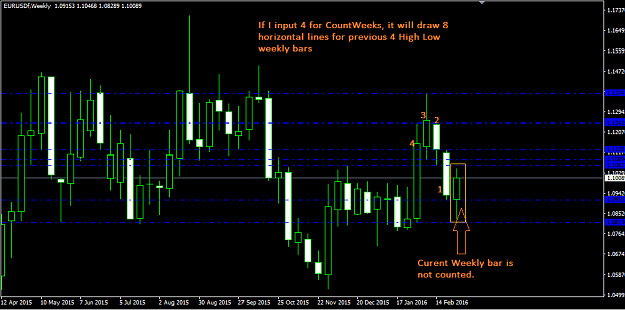
If I type 4 for Weekly High Low, the indicator draws 8 horizontal lines like this,
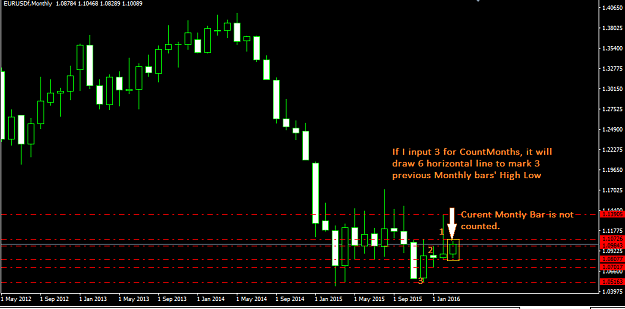
If I type 3 for Monthly High Low, the indicator draws 6 horizontal lines
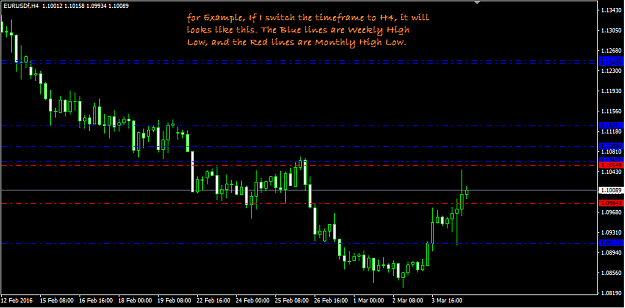
Then when we move to other timeframe it will show both Weekly and Montly High Low (whatever timeframe we choose for example I open H4 TF)
Very very much apreciated if any coder write this indicator.
Thank you.
H
Could anyone please help me to write code for an indicator that showing previous Weekly and Monthly High Low by drawing simple horizontal lines (not Highest and Lowest) or tell me the thread that already shared indicator like this. Here for example
If I type 4 for Weekly High Low, the indicator draws 8 horizontal lines like this,
Attached Image (click to enlarge)
If I type 3 for Monthly High Low, the indicator draws 6 horizontal lines
Attached Image (click to enlarge)
Then when we move to other timeframe it will show both Weekly and Montly High Low (whatever timeframe we choose for example I open H4 TF)
Attached Image (click to enlarge)
Very very much apreciated if any coder write this indicator.
Thank you.
H
Regards