Hello all! I was wondering if anyone had any experience trading fibonacci time zones and timing entry with support and resistance and price action. I got this idea from
http://www.dukascopy.com/fxcomm/fx-a...on=read&id=734
Its uncannily accurate.
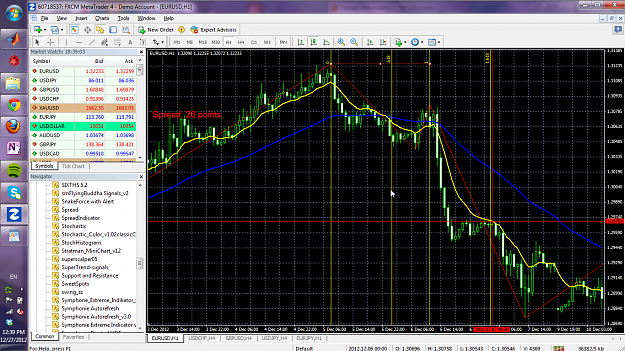
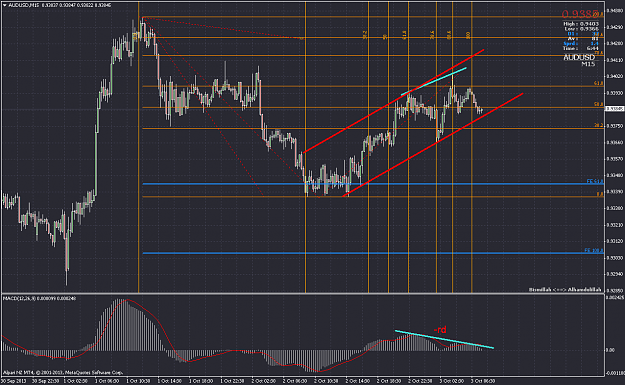
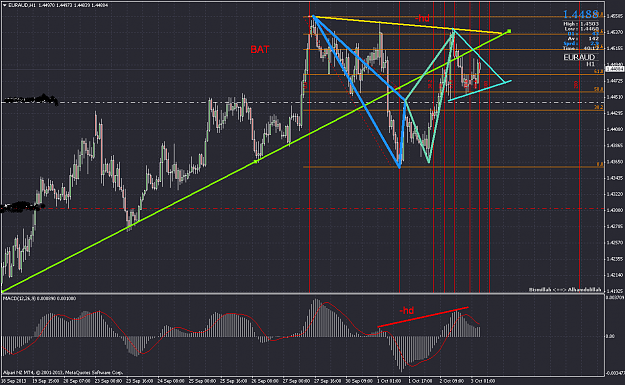
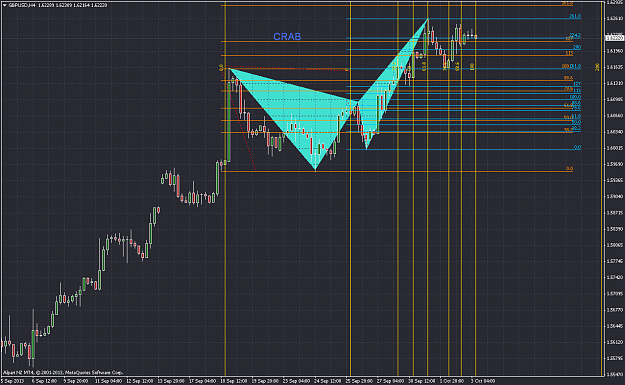
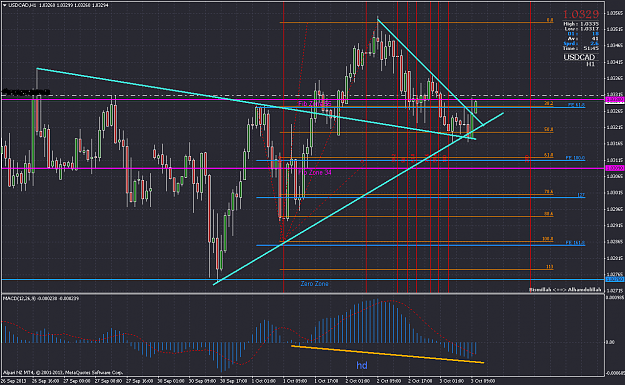
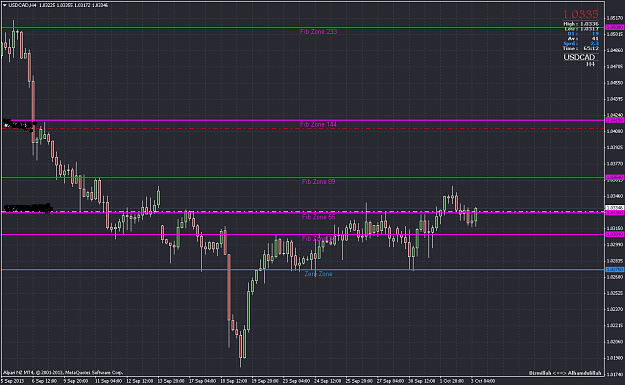
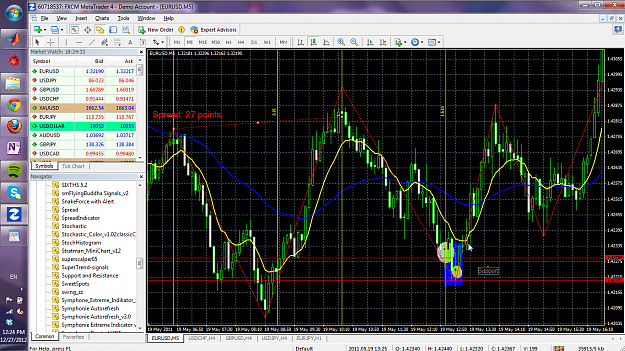
Heres an example. What you do: plot the zigzag indicator on the chart. Use default settings (12 5 3). Draw a fib time extension from any two peak highs or two peak lows. Right click the fib time zone and select properties. delete everything except the following levels: 0, 0.618, 1, and 1.618. Now, you have a projected future price where a turn around will occur, at least temporarily. Look for price action reacting around support and resistance at this time. Enter the trade.
The blue rectangle is a time zone formed by using the fib time zone on a bar to the right of the top formed by the zigzag indicator, since tops arent precise. As you can see, we formed a spinning top (or is it a hammer?) and then later a inverted hammer. Entering at the hangman would've been successful.
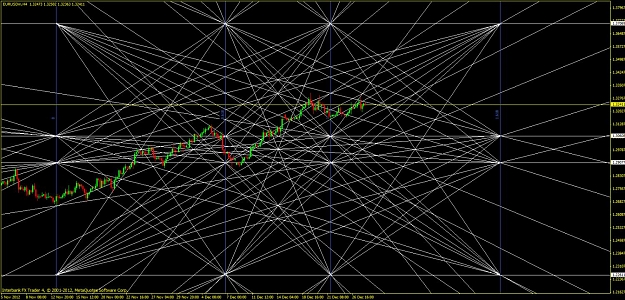
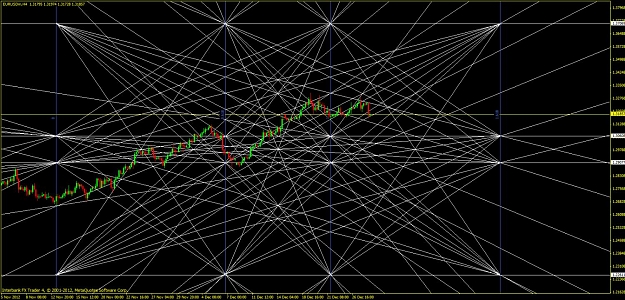
You can literally draw this time zone on any two peak highs and peak lows and see how price reacts around the 1.618 line. Be careful with peaks that are flat, draw the time zone from the middle of those even if the zigzag is slightly different. Pretty neat eh?
Anyways, does anyone have any insights/trades using fib time zones (the 1.618 is golden ratio btw)
http://www.dukascopy.com/fxcomm/fx-a...on=read&id=734
Its uncannily accurate.
Heres an example. What you do: plot the zigzag indicator on the chart. Use default settings (12 5 3). Draw a fib time extension from any two peak highs or two peak lows. Right click the fib time zone and select properties. delete everything except the following levels: 0, 0.618, 1, and 1.618. Now, you have a projected future price where a turn around will occur, at least temporarily. Look for price action reacting around support and resistance at this time. Enter the trade.
The blue rectangle is a time zone formed by using the fib time zone on a bar to the right of the top formed by the zigzag indicator, since tops arent precise. As you can see, we formed a spinning top (or is it a hammer?) and then later a inverted hammer. Entering at the hangman would've been successful.
You can literally draw this time zone on any two peak highs and peak lows and see how price reacts around the 1.618 line. Be careful with peaks that are flat, draw the time zone from the middle of those even if the zigzag is slightly different. Pretty neat eh?
Anyways, does anyone have any insights/trades using fib time zones (the 1.618 is golden ratio btw)
Attached Image (click to enlarge)