{quote} Hey Stevepatt...you have an extremely good grasp of the order flow and are interpreting price action from that flow of orders. I would venture to say that all you have left to do now is devise an entry and exit strategy to exploit your observations and run some numbers on your performance. "Seeing" it in the static charts allow you to anticipate it on the right hand edge. All you need to do is find out how YOU relate to that and that will help you devise your strategy. Well done friend!!
Ignored
Hi gspajon;
Thanks for your feed back.
Finding a consistant entry and exit strategy is the hard part I think it's going to be a work in progress.
I find by writing up these charts, like I've been doing, helps my thought process.
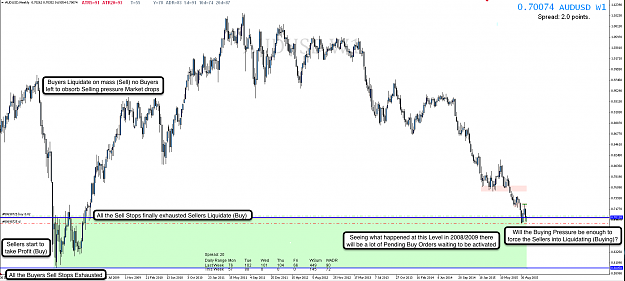
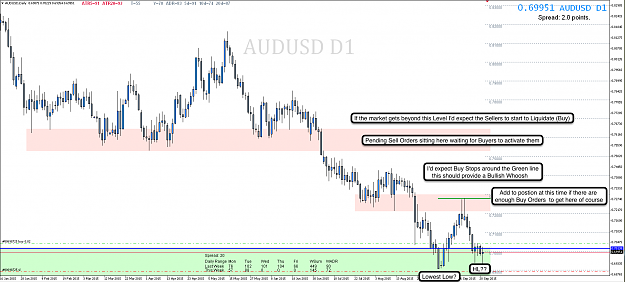
My Long entry on AUD/USD D1 might be a little early but sooner or later the Sellers will Liquidate.
Hi gspajon; Thanks for your feed back. Finding a consistant entry and exit strategy is the hard part I think it's going to be a work in progress. I find by writing up these charts, like I've been doing, helps my thought process. My Long entry on AUD/USD D1 might be a little early but sooner or later the Sellers will Liquidate.
Ignored
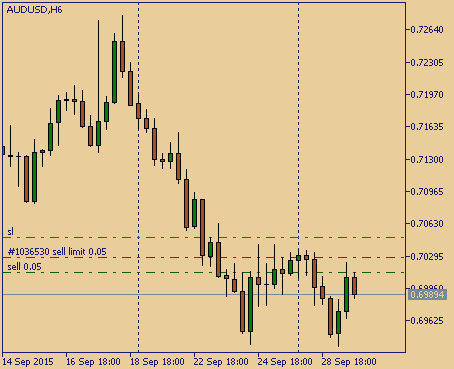
Oddly enough I just entered a short position using an intraday time frame, with another pending sell order just above. I certainly understand why you might be looking for buyers to come in...but so far (on your daily chart)...the best they've been able to do is balance the market for the last few days...
However on the intraday view, the sellers have become dominant again, and are now showing signs that they may stop out the buyers just below...if that happens I expect another "whoosh" lower...however if that does NOT happen, I would anticipate more balancing and the late seller (in this case...me) to stop out right about where I have my stop here.
{quote} Oddly enough I just entered a short position using an intraday time frame, with another pending sell order just above. I certainly understand why you might be looking for buyers to come in...but so far (on your daily chart)...the best they've been able to do is balance the market for the last few days... However on the intraday view, the sellers have become dominant again, and are now showing signs that they may stop out the buyers just below...if that happens I expect another "whoosh" lower...however if that does NOT happen, I would anticipate...
Ignored
Hi gspajon;
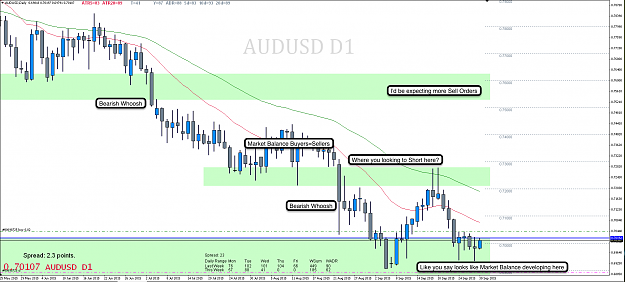
I can see I might have jumped the gun on this Long entry. Can you take a look at the chart below were you looking to Sell where I've indicated on the chart thanks for your help.
Hi gspajon; I can see I might have jumped the gun on this Long entry. Can you take a look at the chart below were you looking to Sell where I've indicated on the chart thanks for your help.
Ignored
Steve....(may I call you "Steve"?)
On you chart where you ask if I was looking to short...I was, but I missed it as I was away from the computer for those two days...but there were two days of opportunity to position there...one of my students grabbed it though.
Here at the bottom it is anyone's guess which way the market will go...I see the buyers and the sellers battling for dominance, thus the balance zone. As I write, my position has turned negative and fired both entries. So a long is NOT out of the question...I realized that my entry on this short is late, and may have to pay the consequence.
I think the real question is what is the USD going to do? Ever since Janet Yellen could make a decision on a tiny 25 basis points move the entire market has been "fibrillating" and it is clear to me that the larger participants are on the side lines letting the smaller participants hammer each other until there are very few left.
hello ! Could you see if my view on MultiTimeframe is correct ?
Ignored
Hello Raffae you are thinking along the right lines...in that you are trying to visualize who is transacting, (buyers or sellers), and seeing the result of their orders. try to keep in mind that the order flow is the same across ALL time frames. The only difference is how the candles are divided (in time) and how much history you show to the left.
Note yesterdays ranging candle (doji) indicating a balance zone on a smaller time frame. The on your 4 hr chart you can see what that looked like. Obviously the buyers have become dominant again... on an intraday basis (profit taking perhaps?), but on the larger basis, I might say, the sellers are still dominant...thus I might try to watch the lower time frames to see where the selling comes in again...remember that in order to reverse any directional move, the opposing side must first balance the imbalance...then take the dominance away and UNbalance the order flow. At times this can only be seen on smaller time frames because it happens quickly...other times it may take 1-5 days.
That cannot be "predicted" only anticipated, and there is no indicator or math formula that will accurately prognosticate. You have to anticipate it and then recognize it when you see it.
{quote} Hello Raffae you are thinking along the right lines...in that you are trying to visualize who is transacting, (buyers or sellers), and seeing the result of their orders. try to keep in mind that the order flow is the same across ALL time frames. The only difference is how the candles are divided (in time) and how much history you show to the left. Note yesterdays ranging candle (doji) indicating a balance zone on a smaller time frame. The on your 4 hr chart you can see what that looked like. Obviously the buyers have become dominant again......
Ignored
thanks
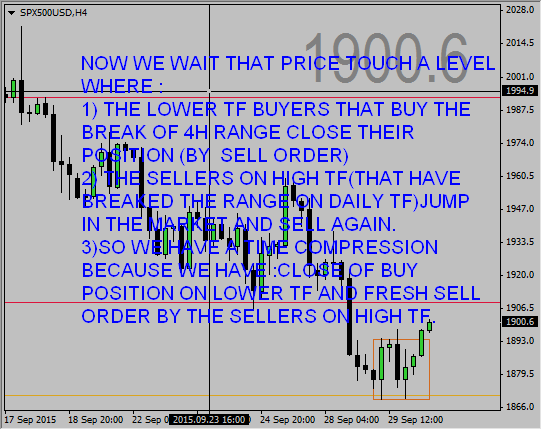
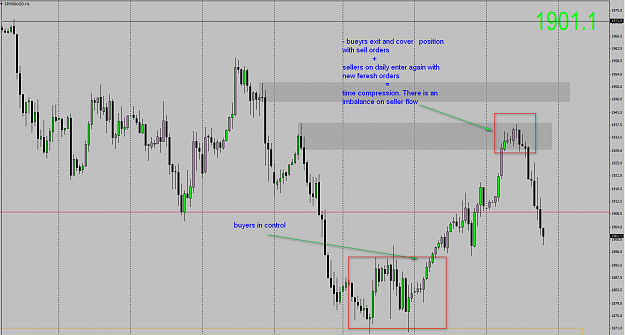
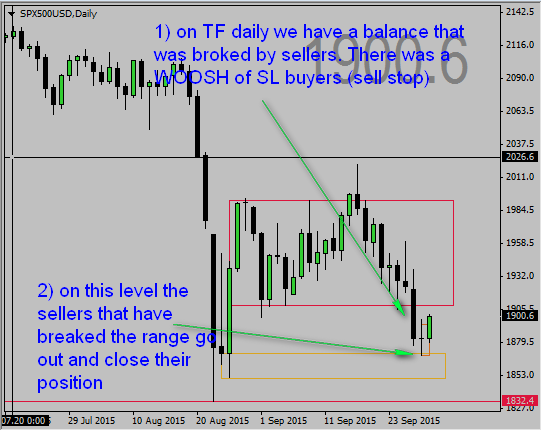
lock at this point where sellers come in again, balance the imbalanced flow (rember that the buyers come in and take the control on the tf lower, as see in my previously post) and re-take the control :
thanks lock at this point where sellers come in again, balance the imbalanced flow (rember that the buyers come in and take the control on the tf lower, as see in my previously post) and re-take the control : sorry for my english
Ignored
You are seeing it very well Rafae I believe you will soon be able to find places where you can take effective action...entries, exits, and stops...I congratulate you on learning this way...it is the most difficult way to do it.
Looking at someone's posts and then trying to "divine" what they are thinking is very difficult, but I think you have done this...well done sir!
{quote} You are seeing it very well Rafae I believe you will soon be able to find places where you can take effective action...entries, exits, and stops...I congratulate you on learning this way...it is the most difficult way to do it. Looking at someone's posts and then trying to "divine" what they are thinking is very difficult, but I think you have done this...well done sir!
{quote} Steve....(may I call you "Steve"?) On you chart where you ask if I was looking to short...I was, but I missed it as I was away from the computer for those two days...but there were two days of opportunity to position there...one of my students grabbed it though. Here at the bottom it is anyone's guess which way the market will go...I see the buyers and the sellers battling for dominance, thus the balance zone. As I write, my position has turned negative and fired both entries. So a long is NOT out of the question...I realized that my entry...
Ignored
Hi gspajon;
Calling me Steve is fine.
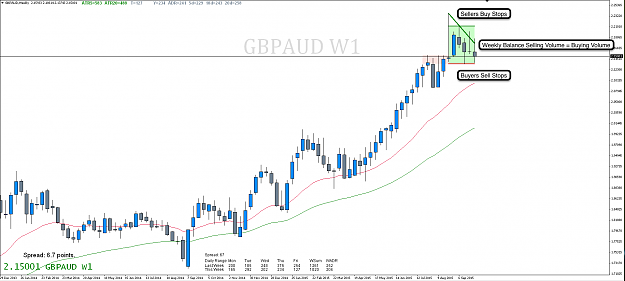
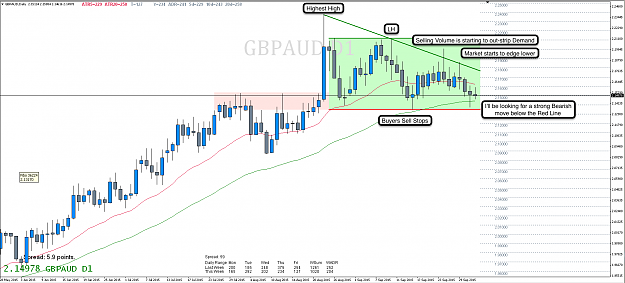
I've been looking at the GBP/AUD the charts below shows what I'm looking for.
If we get that Bearish move I'd be looking for a test of the Red Line I've got marked on my chart.
Here's an example on Dow Jones futures contract: {image} Candlestick are replaced by candles which display Martker orders. At the bottom of the chart you can see the difference between buying market orders and selling market orders within each candle. About the three candles I have highlited. You can see some very negative deltas. Sellers were more agressive than buyers BUT why price didn't move down? BECAUSE there were buying limit orders to absorb those orders. When you see that kind of pattern you want to get long as you understand that large...