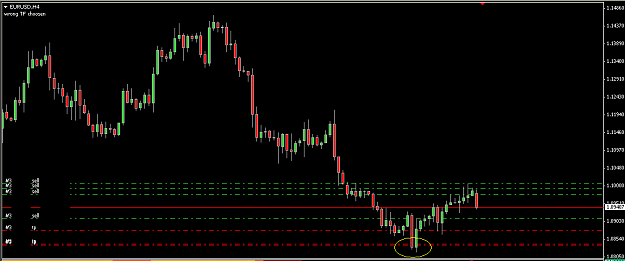
The following chart shows the H4 EURUSD:
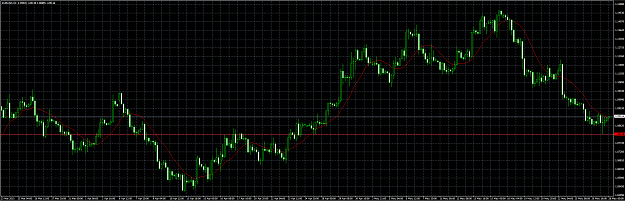
As you can see, there is a fairly consistent resistance level at 1.08188. Recently, a doji candlestick has formed at this level and price seems to be bouncing off of it. In addition to this. price appears to have just crossed the SMA14, which may be used as an entry constraint by some traders. What other analysis might you draw from this chart? Would you see this as an opportunity to go long? If so, when? If not, Why not?
Any analysis of this chart would be appreciated, as I hope it will give me useful insight into the thinking of traders.
Thanks in advance
Attached Image (click to enlarge)
As you can see, there is a fairly consistent resistance level at 1.08188. Recently, a doji candlestick has formed at this level and price seems to be bouncing off of it. In addition to this. price appears to have just crossed the SMA14, which may be used as an entry constraint by some traders. What other analysis might you draw from this chart? Would you see this as an opportunity to go long? If so, when? If not, Why not?
Any analysis of this chart would be appreciated, as I hope it will give me useful insight into the thinking of traders.
Thanks in advance