I'll share my technical analysis based on "Bollinger Bands + RSI" strategy, which has proven to be very profitable to me.
This strategy is not one-fits-all so for each instrument you need to look at a different time frame. For example, on Gold it works very good on Daily chart, and for oil on H4 chart.
Gold: On Daly chart Bolinger bands Gold is steadily moving towards its lower band around 1171 area where it would likely hit the oversold areas of the RSI. 1171 is also a good support area from pervious PAs. So, I guess it would be a good area to long from there all the way to 1210 or above again. Stop-loss? Up to you! I normally place is based on previous PAs, for me 1140 would be stop-loss for this move. If you do too, this setup will be a bit better than 1:1 reward ratio.
"Oil: On H4 chart it already trigers the buy senario, but I guess 58 would be a good area to long. Stop loss below 57.40, target 60.70 or above" Correction: For Oil, it has hit the lower boolinger bands on H4, but hasn't gone to oversold on RSI. Which will msot likely touch around 58.
It's just a simple strategy which makes me money, hope might do some good to you too.
Any comments or suggestions for improvement are highly appreciated.
I'll share my technical analysis based on "Bollinger Bands + RSI" strategy, which has proven to be very profitable to me. This strategy is not one-fits-all so for each instrument you need to look at a different time frame. For example, on Gold it works very good on Daily chart, and for oil on H4 chart. Gold: On Daly chart Bolinger bands Gold is steadily moving towards its lower band around 1171 area where it would likely hit the oversold areas of the RSI. 1171 is also a good support area from pervious PAs. So, I guess it would be a good area to...
Ignored
What is the periode that you use for bolinger bands? 20? And for RSI?
{quote} What is the periode that you use for bolinger bands? 20? And for RSI?
Ignored
I'm using just the default settings, 20 and 14, respectively. Let me know if it proves to be any good for you, or if you can manage to get better results by tweaking the settings.
{quote} I'm using just the default settings, 20 and 14, respectively. Let me know if it proves to be any good for you, or if you can manage to get better results by tweaking the settings.
Ignored
I'm new in trading. I just started testing on bollinger bands 12 (period:12, Deviation: 2, Shift: 0), along with Stochastic 7,3,3 on D1 time frame. I use them on H1 to.
D1 is for finding bigger trends, and H1 is for finding entry or for intraday trading.
I might testing on your setting as well.
Cheers
Its quite simple. Read about bollinger bands you'll get a clearer picture. I normally wait for the price to touch the lower band, at the same time see if RSI reflects oversold i.e. below RSI 30. Then just buy from there! However, its an added advantage and recommendable to study price action and historical support levels to get a better entry.
{quote} I'm new in trading. I just started testing on bollinger bands 12 (period:12, Deviation: 2, Shift: 0), along with Stochastic 7,3,3 on D1 time frame. I use them on H1 to. D1 is for finding bigger trends, and H1 is for finding entry or for intraday trading. I might testing on your setting as well. Cheers
Ignored
You are welcome to the forums and Best of luck with your strategy. Would wait to know if you get success with yours or mine strategyAlso, I am quite confident that Bollinger bands dont work one-size-fits-all. E.g. on H1 i dont see PA respects the bands... not with default settings atleast, but with D1 it shows better alignment.
{quote} I'm using just the default settings, 20 and 14, respectively. Let me know if it proves to be any good for you, or if you can manage to get better results by tweaking the settings.
Ignored
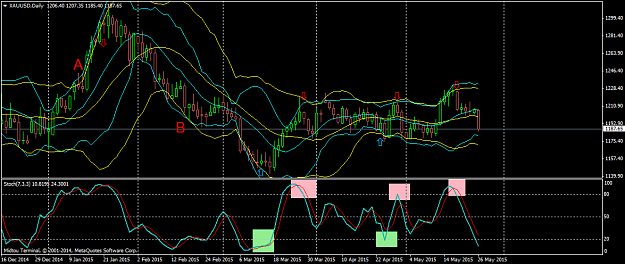
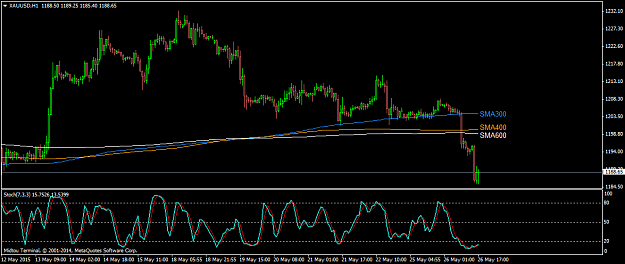
But the problem with Bolinger bands is when price breakout. Like point A and B in the pic. Candles continously touching outer band while Stoch or RSI already on overbought or oversold area. Both Bolinger with Stoch/RSI cant detect when the trend gonna stop. Some using SMA (Simple Moving Average) 300, 400, 600 to detect when the trend will reverse, but like we see today on gold, SMAs sometime is useless, or its just me that confuse using SMAs
{quote} But the problem with Bolinger bands is when price breakout. Like point A and B in the pic. Candles continously touching outer band while Stoch or RSI already on overbought or oversold area. Both Bolinger with Stoch/RSI cant detect when the trend gonna stop. Some using SMA (Simple Moving Average) 300, 400, 600 to detect when the trend will reverse, but like we see today on gold, SMAs sometime is useless, or its just me that confuse using SMAs {image} {image}
Ignored
Sure! There is no strategy on face of the earth which can give you 100% wins, thats the reason why we use stop loss (I prefer hedging). In your screenshot it gives a quite good win to loss ratio. Anyway, to avoid losses in I try my best to figure out reversals on PA (also avoiding opening new positions when bands are narrow), its best to enter on strength. Also try to avoid this strategy altogether (or any other technical strategy) during most important fundamental events i.e. fed's bullshit.
SMA's are good! I use 'exponential' SMA 12 and 36 usually to see volatility and figureout reversals.
Patience is the key for this or any other strategy.
{quote} I'm new in trading. I just started testing on bollinger bands 12 (period:12, Deviation: 2, Shift: 0), along with Stochastic 7,3,3 on D1 time frame. I use them on H1 to. D1 is for finding bigger trends, and H1 is for finding entry or for intraday trading. I might testing on your setting as well. Cheers
Ignored
I love this thing.. back-testing strategy with different settings.. to figure out your win-rate.. thus, one can predict his tentative Profits.. simple maths once you have a proven strategy.
{quote} I love this thing.. back-testing strategy with different settings.. to figure out your win-rate.. thus, one can predict his tentative Profits.. simple maths once you have a proven strategy.
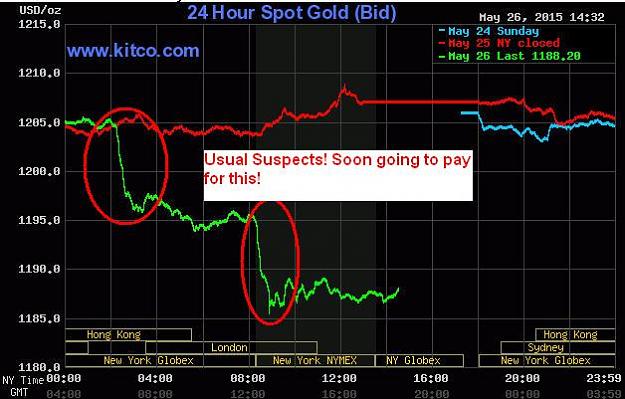
Anything new? Crooks are pissed that stupid Stock Market is down Long-- target 1207 {image}
Ignored
Bro, you have SL for most of your calls? I noticed recent trade calls from you were drown. I believe majority of the traders cant take that much drop if they heed your manipulation theories. Investing vs Trading.
As for your previous post on rate hike, I also don't believe there will be a rate hike this year, if there is one, most likely will be unexpected/surprise.
The only winner is the one who survive the longest...
i am bull on gold though fed says they want to hike interest rate, watch what they do not wht they say. Gold Prices Show a Potential Ascending Triangle Pattern http://marketrealist.com/2015/05/gol...angle-pattern/
Ignored
Bro, you can take a look at GLD and GDX to track Gold movements too.
Good sharing Bro. There are 2 kind of indicators, technical and fundamental indicators, finding the sentiment of trade movement, then apply technical levels.
The only winner is the one who survive the longest...
{quote} I love this thing.. back-testing strategy with different settings.. to figure out your win-rate.. thus, one can predict his tentative Profits.. simple maths once you have a proven strategy.
Ignored
I'll re-phrase this..
I love this thing.. back-testing 'a' strategy with different settings.. to figure out 'and improve' your win-rate.. thus, one can predict his 'projected' tentative Profits.. simple maths once you have a proven strategy..
It would be interesting to see where gold goes today since no data from US. Dollar is already showing some weakness.. I am bullish biased but 1200 seems pretty hard to break today. Have a great day every1