Notice:
I put all my code out here publicly for free (Open Source!) but I do not guarantee that everything works without flaws and I do not take responsibility for harm done to a person in any ways. If you find any bugs or have improvements feel free to contact me. There is no reason for me to keep the code to myself and I annotate it as much as possible as I want the time that went into the creation to be of help for others. Even if my code might not be the best coding style looking at other examples might help people with their programming. All in all please please please always post the mql4 file if you want to distribute anything related to the code posted here and keep the copy right notice in the file. If I find anyone who intentionally ignores this I will simply leave and keep everything for myself again.
Table of content
- Code
- CustomChartScale
- ScreenSynchronization
- SimpleChartNavigation
- PABacktester
- ChartSetup
- Whats up next
- Help the File xxx does not work.
- Mt4 navigational tips
- Ranting about programming requests
Upcoming releases: (Whenever I have time)
- CommonFunctionLibrary
- MoneyManagement class
- OfflineChartFramework
- Java Mt4 Bridge + API
- Mql4 video capture support
- Greasymonkey script (FF) mql4 code syntax highlighting
----------------------------------------------------------------------------------------------------------------------------------------------------
CustomChartScale
Type:Indicator
JensG asked if there is a possibility to increse the font size of the price scale for better visibility. (http://www.forexfactory.com/showthre...77#post8271277)
The code hides the charts original price scale as well as the grid and draws a new customizable scale and grid on the chart.
If the chart width or height changes due to resizing it needs little bit time to readjust the background of the scale. Scrolling back and forth helps.
Parameters
clrNone usually means use the chart default color
------Label Settings------
color Label Color | Color of the price tags
uint Font Size
int xLabelOffset | Left and right adjustment
int yLabelOffset | Up and down adjustments
The greater the value the further away. The offset also gets adjusted automatically with the font size and screen width.. Negative values are allowed to shift in the other direction.
------Price Background -------
color backgroundColor;
color borderColor; | in pixel
int widthScale = 110;
------Grid Settings------
color Grid Colory;
ENUM_LINE_STYLE Line Style
int Grid Line Width
int Number Grid Lines | number label lines
Preview:
----------------------------------------------------------------------------------------------------------------------------------------------------
ScreenSynchronization
Type:Indicator
This is a really really simple indicator which mirrors the chart scrolling of one chart to defined other charts. It tries to set the open time of the right most candle equal on all charts. Due to mql sometimes counting half candles on the chart and sometimes not here can be an offset of 1 2 bars occasionally.
The code is not fancy or nice but it's doing it's job
Parameters
enum ChartSelection
{
ALL_CHARTS,
SAME_CURRENCY,
SAME_CURRENCY_AND_TF,
SAME_TF
};ChartSelection syncronize = ALL_CHARTS;
Preview:
----------------------------------------------------------------------------------------------------------------------------------------------------
SimpleChartNavigation Widget
Type:Indicator
I am trading news events and finding the exact time on a chart can be bothersome. (You can press enter and input the symbol and time but I never really liked that feature) Simply put in the desired time symbol and timeframe and the widget will move the chart there. I just finished it yesterday and it was one of the first times I worked with the mt4 gui.
Parameters:
bool autoDisableAutoScrolling //Disable Autoscrolling After Jump
bool markJumpWithTrendline // Draw Trendline At Destination
color trendlineColor /Trendline Color
int tWidth //Trendline Width
Preview
----------------------------------------------------------------------------------------------------------------------------------------------------
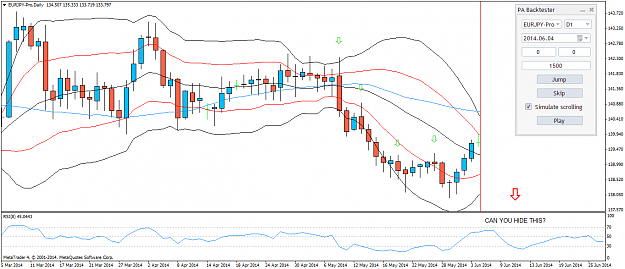
PA Backtester
Type:Indicator
A few years ago Tyoon asked for an indicator which could hide parts of the screen (http://www.forexfactory.com/showthre...92#post5316792) A few days ago I was asked by a member of this forum if I can make it support jumping between multiple timeframes and decided to rewrite the entire thing.
All it does it moving a huge lable over the candles in the desired speed enabling you to practice pa during the weekend or to look at charts and compare your prediction with reality in an easy way. You can do the same with the visual strategy tester mode but you can not look at different time frames or set the speed exactly to what you want. I am not sure if it's useful or not but I leaned a lot about gui programming when creating it.
Parameters:
clrNONE = chart background color
color hideAreaColor
color trendlineColor //Border Color
int initialMSSpeed //Scroll Delay Speed
Changelog:
- 01.06.15 V3 Fixed a bug that covered half the last candle.
- 25.05.15 V2 Indicator now also hides the indicator window. (See http://www.forexfactory.com/showthre...51#post8282851 for the original version). Everything seems to work alright until you add a new indicator after the PA_Backtester has been added to the chart. This seems to break this indicator but due to me being on holiday tomorrow for a week and me wanting to release this version before you have to live with that for now.
Attachment
------------------------
ChartSetup
Type:Script
This is a 2 line script which allows you to hide the price and time scale. I have not found a way to do this without a script. (I guess here is no copyright needed ![]() ).
).
Parameters
bool showTimeScale;
bool showPriceScale;
----------------------
Up Next
CommonFunctionLibrary:
Type:IncludeFile
This looks roughly like hanovers common library but with less string functions and more focus to object orientation, byte and network support.
I think very useful is the implemented of hashtables which allows you to store Key/Value pairs. For that all primitive data types are wrapped into an own class.
MoneyManagement library.
Type:IncludeFile
This is probably one of the most useful code selections I have. It performs the tp sl and lot calculation based on defined values. You can switch between 4 or 5 different money management models like risk based,fractional,fixed fractional, (anti/martingale (maybe I take this out)) etc ..
OfflineChartFramework.
Type:IncludeFile
Offline charts are simply charts whose data feed is written by ourselves meaning we push what ever values we want to the candle whenever we want. This allows us the creation of renko tick and all kinds of other charts which behave almost exactly like usual mt4 charts.
If you have a lot of different offline charts writing the hist file is probably the most annoying task to do which is exactly the same for all kinds of offline charts so I decided to create a framework for it.
The superclass takes care of all the file handling and the emulation of the update commands.
Every custom chart type has a subclasses which has to take care about what happens with the current data every tick. If a custom bar opening different from the attached chart is wanted this condition has also be stated.
In depth documentation will be posted when released and this one is cleaner and better commented than everything else I have posted here.
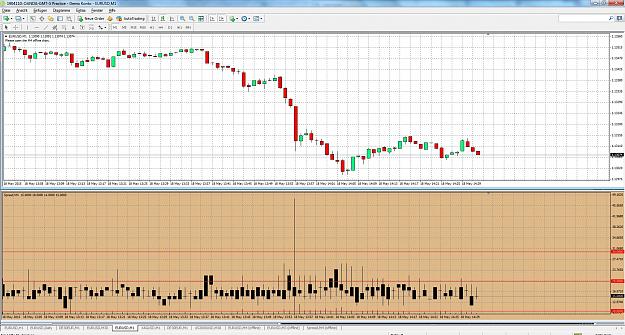
Example to implement an own chart which shows how the spread changed during the time:
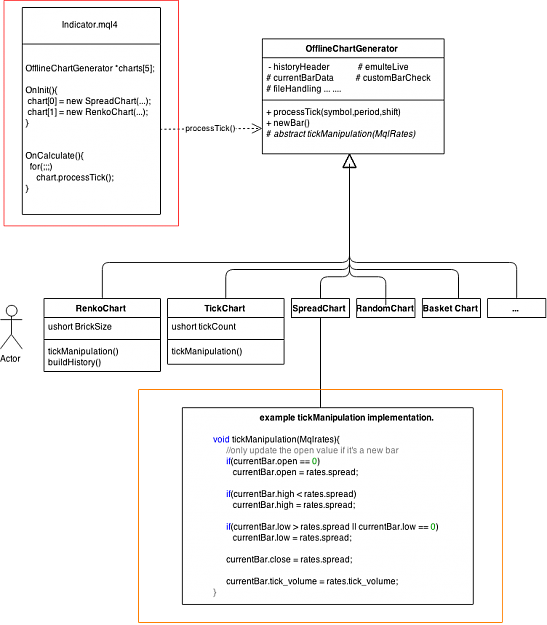
Red: An indicator with 3 lines of self written code has to be applied to the chart.
Orange: TickManipulation: The logic about what data should be displayed in the current bar.
And you are basically done. Now you get a chart which shows you how the spread changed and you could analyze it with moving averages or your super macd if you wanted.
Already implemented and ready to use
TICK_CHART = 1, (with # of ticks/chart as input)
RENKO_CHART = 2,
SPREAD_CHART = 3,
BASKET_CHART = 4, (multi currency)
CUSTOM_RENKO_CHART = 5, (taking vertain properties of tf based and renko charts and combining them)
PERIOD_CHART = 6, (12 min chart? No problem)
RANDOM_CHART = 7; (simple randomly gaus number generated chart with x% probability to increase and 100 - x% probability to decrease every tick)
I want a ranged bar chart as well but it's not finished yet.
Java bridge and api: Not much to say, I just like programming in Java
------------------------------------------------------------------------------------------------------------------------------
Help the code does not work
While there might be bugs in the code the indicator should usually initialize and run at your terminal. I did my best to test everything before releasing it but if you find any bugs feel free to post them.
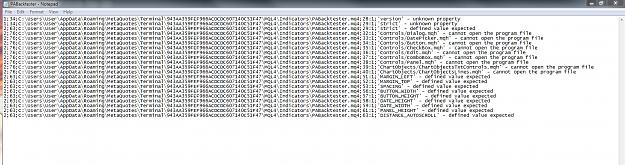
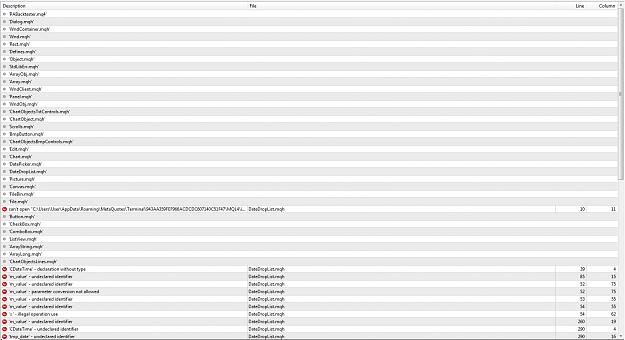
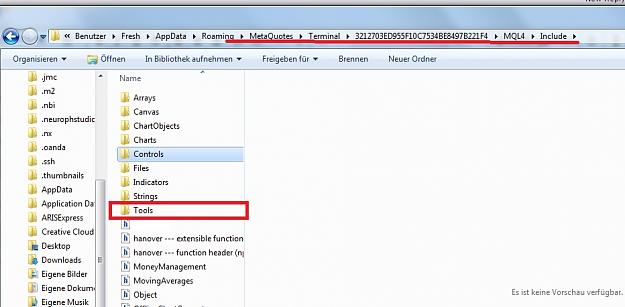
If you put the file in the correct folder and it still does not run there might be some important include files missing which should usually already be included in the default installation of your terminal. If you encounter this problem you open the corresponding indicator in your metaeditor and try to compile it.
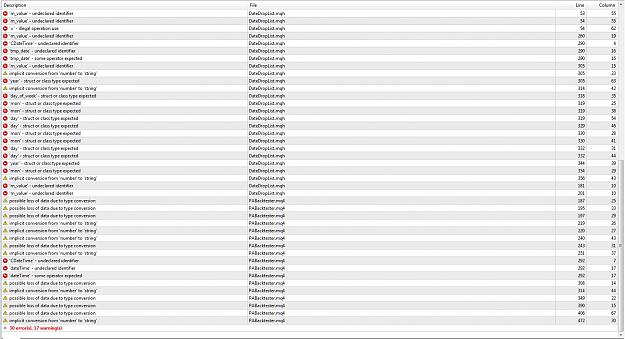
At the bottom warnings and errors displayed. You can ignore everything with a yellow sign next to it but if there is a red circle the code will not run. Keep an eye out for something that says
"can't open" ...........

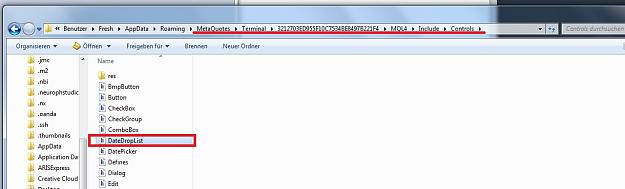
It tells us that the file DateDropList.mqh can not be found and opened. To fix this you have to put the missing file in the correct directory and you should be good.
Here are all files that could be missing at your terminal (if you can't find a certain file just tell me and I will upload it).
Mt4 navigational tips:
While these might be obvious for frequent traders I have only found those little arrow recently (or found them earlier and forgot about them again
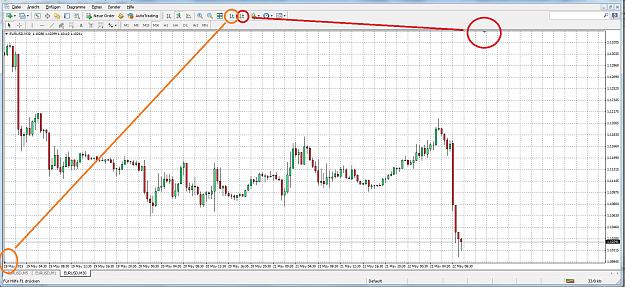
1: if you enabled the chart shift you can drag the little arrow at the top of the chart to determine how much space you have at the edge of the chart.
2: this arrow has been hiding from me for a long time. If you disable! autoscrolling you can drag this arrow to a position on the chart and the bar which is at the same height as this arrow will be the fix point for zooming. If bar A is 300 px from the left side of the screen it will always stay these 300 px away from the side during zooming in and out.
Please for the sake of programming requests:
Creating a thread about mql4 carries the risk that people send pms requesting to program eas for them. I am not interested in creating EAs as past has thought me that this is mostly wasted time. It took me years of preparation and roughly 15 months of designing testing and coding my personal ea. There is no such thing as you having a good idea while showering and it's magically working if put into code. Either you have a concept and can prove it for a long timeframe (not just eyeballing) or it's most likely not going to work. Do your homework before contacting someone you want to work for you for free.
Someone here on the forum said a person who can formulate requirements can program himself, and sadly this is true in most cases. I have never seen a mechanical EA request which could be translated 1:1 into code. Gems include the ea should differentiate between real breakouts and fake spikes or if the price moves to far away do something.
While this is a little bit of topic a few words to system design. You first should make up your mind about what could work and why it could work.
I have seen so many eas being write which got heavily curve fitted to the past. It's essentially the same thing like telling the ea the exact timestamps it should take trades for back test purpose. Either it already works like you intended from the beginning or it's most likely not going to work at all.
If you start to add filters to make it profitable you might want to stop already and try to think about another way to achieve your goal. I have seen so many filters requests being made to existing eas and how many have improved them? 0!
The best suggestion I can give you is to focus on money management. While it can not turn an unprofitable system into a profitable one (like martingale people are claiming!) it will certainly have the biggest impact on your trading results.
Additionally I do not create indicators or simply add an alert. I like to write utility code which differentiates from the great mass of already existing indicators. Basically things that could be beneficial in one way or another apart from telling you where the price is going. Indicators usually get requested, it takes a long time to program them and then they are thrown away after a few minutes of testing. Next step is to add an alert and after that another filter a dashboard and mtf support. I have had no luck with technical indicators but only with a combination of technical and fundamentals and believe me I have coded more indicators myself as most of you have probably tried out in your trading carrier.