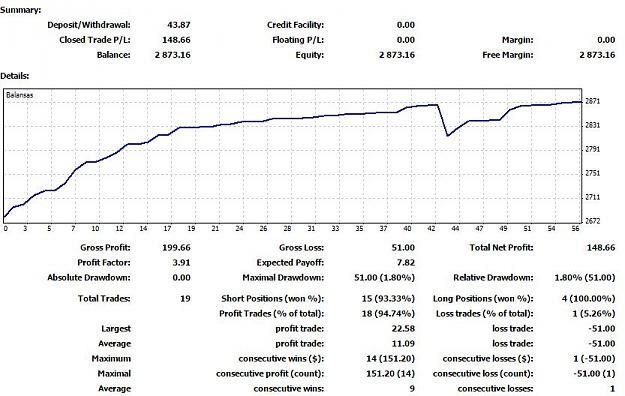
After 4 years of going back and forth, I believe I have finally matured at trading and mastered a simple trading system. I am using two indicators to trade. I am posting results of my last 56 trading days. I also have longer track of this method I am using ( 4 months) but it is not that clear, and I had couple big minuses (slippages) when trading the news with Buy/Sell Stop's which helped me decide which broker to use for trading.
I am not the creator of these indicators or somehow attached to the creators, I have bought these indicators myself and will be posting results.
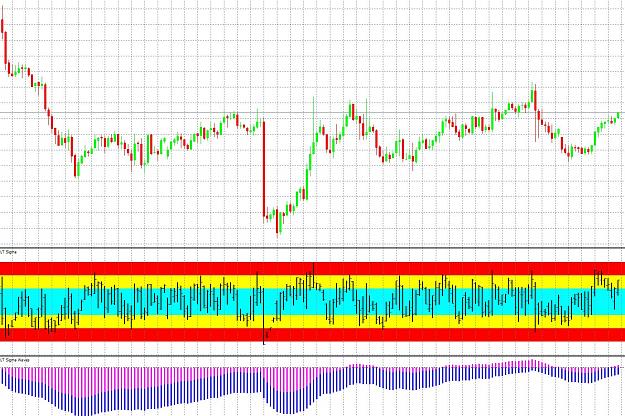
Indicators: LT Sigma and LT Sigma Waves. They are activated by sellers when you receive them using additional software so there is no point putting files up because they will not work.
These results were achieved trading with ~2.500$ and no "shooting" during the news. For trade opening I am using only 0.1 lot which is equivalent for 1$ per pip.
If someone is interested, have questions about the indicators, or want to analyze my full results which I am open to share with everyone.
I am going to explain my strategy in a bit more detail, you will also find my whole history of trading with these indicators right here: http://www.filedropper.com/allhistory_1
MORE IMPORTANTLY :
1. I HAVE NOTHING TO SELL FOR YOU GUYS, THIS IS PURELY MY EXPERIENCE AND RESULTS SO FAR USING THIS STRATEGY.
Back to the real stuff. You can download my trading history and you will see as I have mentioned big SL which I got from trading NZDUSD on the news. This resulted in -100 points which is equivalent to ~100$. SL was hit because of the SLIPPAGE during the news. What is slippage?? everyone can google that in 1 minute
Next day I got another -50 in USDJPY, which was purely mismanaged trade as I was psychologically broken after NZDUSD fail.
Furthermore, I Would not call these indicators "magical" as they have to be MONITORED very carefully and I as a trader had to adapt to them. What I was able to notice is the difference in using them at the different time frames. In bigger the time frame charts signals are stronger, but on the other hand to get the good signal in 4 hour or daily chart is very VERY rare. Also when using the indicator for bigger time frames the SL and TP differs from 30 min or 1 hour (they increase in bigger time frame).
To put it in simple words, the top and bottom indicators must be on the different sides ( Momentum DOWN - Sigma UP) so we are playing safe with trend and basically catching market where it should not belong for a long time (red zones). IF both of the indicators are on the same side or momentum is uknown I DO NOT TRADE the red zones. CHECK SCREENSHOTS AND YOU WILL UNDERSTAND EVERYTHING.
Where I exit the trade ? Most of my trades are very small and without too much risk as this account was copied by many other real accounts, this explains the "commission" money I have received on my statement, but it is no more than ~40-50$. So psychologically, I did not want to lose my or other trader's money who were connected to me, which I believe is a big problem now as I am not able to test it to the full limits. Closing the trade: I do that when sigma moves into the blue zone and if the situation is clear that is going down I wait until the opposite yellow zone so TP is different all the time.
I hope I will attract less skeptical people to this thread and this will look less "scam" by explaining more stuff, but I feel there is so much more to write, which I will do every day with more screenshots.
Everyone is welcome to follow me at twitter @lc_forex where it is easier and quicker to put everything up, message me with questions on private messages or just replying to the THREAD

p.s. sorry for grammar English is not my native language.
Happy trading everyone, hopefully someone will catch this post
I am not the creator of these indicators or somehow attached to the creators, I have bought these indicators myself and will be posting results.
Indicators: LT Sigma and LT Sigma Waves. They are activated by sellers when you receive them using additional software so there is no point putting files up because they will not work.
These results were achieved trading with ~2.500$ and no "shooting" during the news. For trade opening I am using only 0.1 lot which is equivalent for 1$ per pip.
If someone is interested, have questions about the indicators, or want to analyze my full results which I am open to share with everyone.
I am going to explain my strategy in a bit more detail, you will also find my whole history of trading with these indicators right here: http://www.filedropper.com/allhistory_1
MORE IMPORTANTLY :
1. I HAVE NOTHING TO SELL FOR YOU GUYS, THIS IS PURELY MY EXPERIENCE AND RESULTS SO FAR USING THIS STRATEGY.
Back to the real stuff. You can download my trading history and you will see as I have mentioned big SL which I got from trading NZDUSD on the news. This resulted in -100 points which is equivalent to ~100$. SL was hit because of the SLIPPAGE during the news. What is slippage?? everyone can google that in 1 minute
Next day I got another -50 in USDJPY, which was purely mismanaged trade as I was psychologically broken after NZDUSD fail.
Furthermore, I Would not call these indicators "magical" as they have to be MONITORED very carefully and I as a trader had to adapt to them. What I was able to notice is the difference in using them at the different time frames. In bigger the time frame charts signals are stronger, but on the other hand to get the good signal in 4 hour or daily chart is very VERY rare. Also when using the indicator for bigger time frames the SL and TP differs from 30 min or 1 hour (they increase in bigger time frame).
To put it in simple words, the top and bottom indicators must be on the different sides ( Momentum DOWN - Sigma UP) so we are playing safe with trend and basically catching market where it should not belong for a long time (red zones). IF both of the indicators are on the same side or momentum is uknown I DO NOT TRADE the red zones. CHECK SCREENSHOTS AND YOU WILL UNDERSTAND EVERYTHING.
Where I exit the trade ? Most of my trades are very small and without too much risk as this account was copied by many other real accounts, this explains the "commission" money I have received on my statement, but it is no more than ~40-50$. So psychologically, I did not want to lose my or other trader's money who were connected to me, which I believe is a big problem now as I am not able to test it to the full limits. Closing the trade: I do that when sigma moves into the blue zone and if the situation is clear that is going down I wait until the opposite yellow zone so TP is different all the time.
I hope I will attract less skeptical people to this thread and this will look less "scam" by explaining more stuff, but I feel there is so much more to write, which I will do every day with more screenshots.
Everyone is welcome to follow me at twitter @lc_forex where it is easier and quicker to put everything up, message me with questions on private messages or just replying to the THREAD
p.s. sorry for grammar English is not my native language.
Happy trading everyone, hopefully someone will catch this post
Attached Image (click to enlarge)