{quote} Hi georgeben, could you please explain what a 'decending up curve' is please?
Ignored
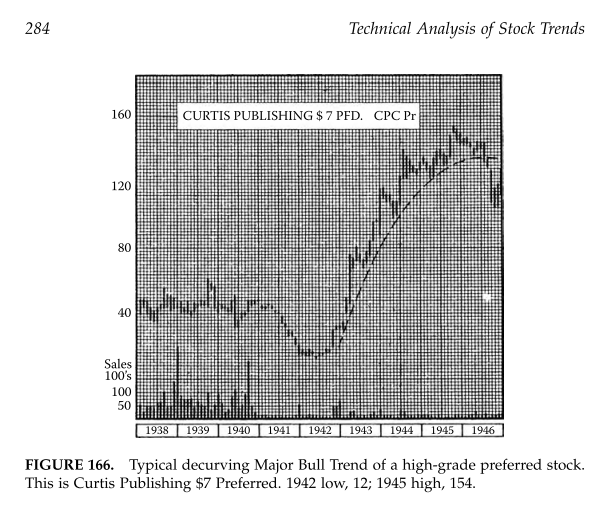
I had read the book of Robert Edwards's technical analysis of stock uptrend and learnt the term.
Decurve uptrend is oppose to accelerate uptrend and i had attach the photo of the book
But decurve uptrend seems not very common.
I am sitting for Fed Rate Decision next week.
In past few trading days, US dollar had smaller correction because people were talking about Fed is not in hurry to raise interest rate.
USD has been retracing since Oct 3rd and I think it's time for it to gain some strength again. Tomorrow there's important EZ data comming out as well as US unemployment claims, maybe the strongest gains will happen tomorrow. IMHO shorters would take proffit at around 1217
Ignored
Hello golden mates
Due to not-so-good data set comming out, I'm moving my TP from 1217 to 1218
{quote} do you think its going to go up again or go down? from your picture it goes up..
Ignored
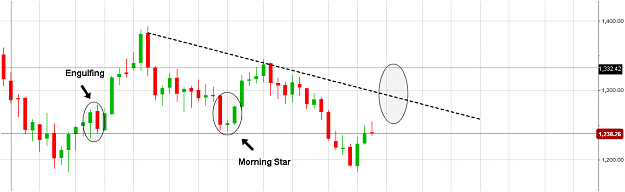
High probability of PA intersecting the free space where that circle is on the chart (actually lower that a bit so its inline)- there have been two significant events within that price range previous. A failed engulfing pattern, followed by indecision then an extension - very powerful PA. Ask yourself why didn't PA then retrace fully but instead formed a HL by a morning (doji) star formation (no real gaps in FX). However, what happens after that is anyones guess. (Ummm... or I could be completely wrong )
{quote} I had read the book of Robert Edwards's technical analysis of stock uptrend and learnt the term. Decurve uptrend is oppose to accelerate uptrend and i had attach the photo of the book But decurve uptrend seems not very common. {image}
Ignored
Many thanks georgeben! I have never heard that term before. I will look up the reference thank you!
{quote} High probability of PA intersecting the free space where that circle is on the chart (actually lower that a bit so its inline)- there have been two significant events within that price range previous. A failed engulfing pattern, followed by indecision then an extension - very powerful PA. Ask yourself why didn't PA then retrace fully but instead formed a HL by a morning (doji) star formation (no real gaps in FX). However, what happens after that is anyones guess. (Ummm... or I could be completely wrong )
Ignored
Hi,
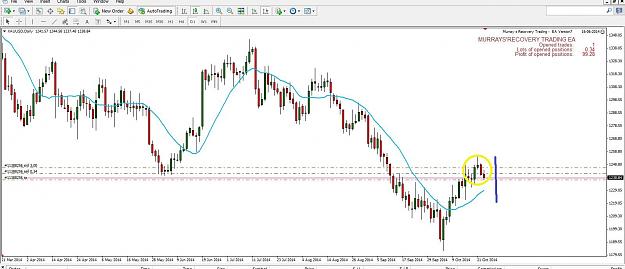
According to the weekly chart attached, my analysis suggests to me that price has plenty of scope to make 1300 plus in the coming weeks/new year, notwithstanding some pitfalls along the way. The dotted verticle line and red colours support my view for a long. On that basis a long term small position size uncomplicated investment is my idea of planning ahead, and using the smaller t/frames for intraday bread and butter etc.
We all see things differently of course, but thats my broad take on my projection ahead anyway for what its worth.
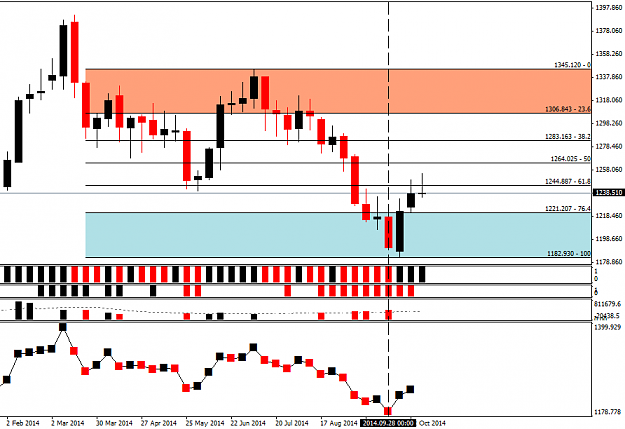
My two cents: According to my (very limited) understanding of Elliot Wave, we have a triangle with 5 3-wave substructures. ABCD has formed, with wave E still forming. {image}. Wave C is 78.6% of Wave A. So perhaps Wave E= 78.6% of Wave C (1345) ? The subwaves 1-2-3 follow a fib ratio. All quite interesting - unfortunately, it does not tell us where wave 1 (of the current wave E) will end, before the corrective wave 2. Also according to EW, after Wave E ends, price will continue in the direction it was in before this triangle started i.e. down, below...
{quote} IF there is a bottom-out ahead in the US session, a nice & neat one, I might wanna re-load longs. Too confusing right now, need a break.
Ignored
I'm looking for some longs too, as lower TF such as m5/m15 printed some good PA and volume for longs, only H1 is weak, so i'll wait for it to turn up and load some
[highlight=rgba(255, 255, 255, 0)]LARGE RISE: Economists forecast that weekly applications increased 16,000 to a seasonally adjusted 280,000, according to a survey by FactSet.[/highlight]
it is forecasted a red data for US's jobs this afternoon , but I dont know that the market how will act it!