![]() ► Financial Markets Observatory Lab. ◀
► Financial Markets Observatory Lab. ◀![]()
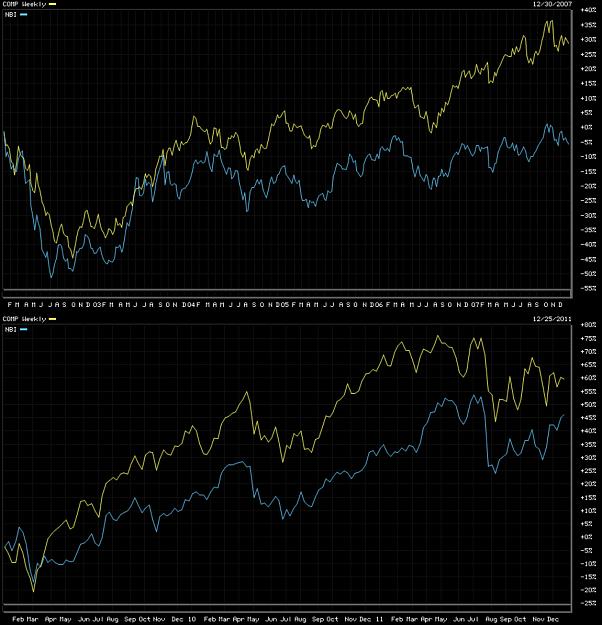
Some notes/charts about the regression trend of S&P500 inflation-adj.
Aim of the post.
This post is a short-note about S&P500 inflation-adj. vs. its regression trend and vs. its variance.
General stocks-benchmarks usefull for this post.
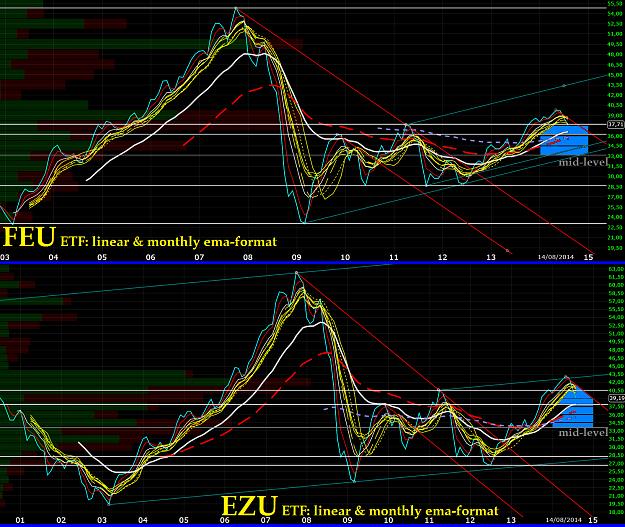
► main U.S. stocks-benchmarks (charts & notes: QQQ; ONEQ; DIA; OEF; SPY);
► global U.S. stocks-benchmarks (charts & notes: EUSA; ITOT; IWB; IWV; IYY; THRK);
► global World stocks-benchmarks (charts & notes: ACWI; DGT; IOO; NYSE W.L.I.; ONEF; VT).
Main graphical elements.
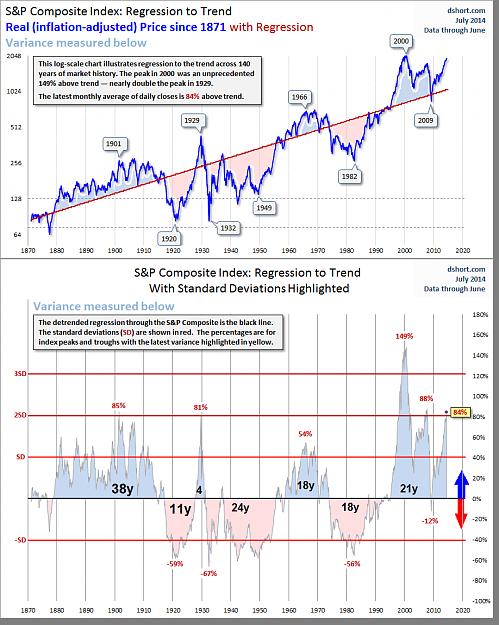
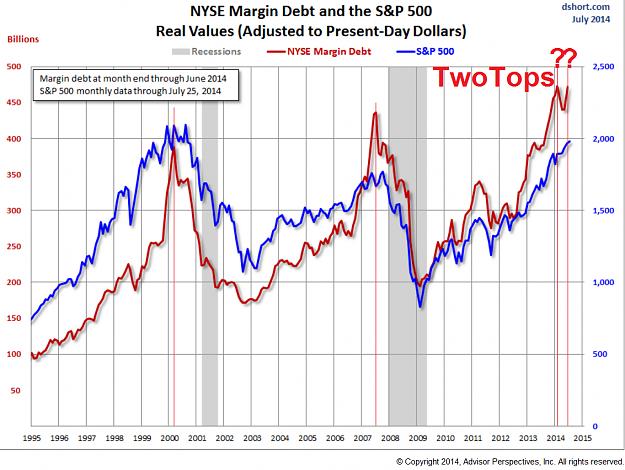
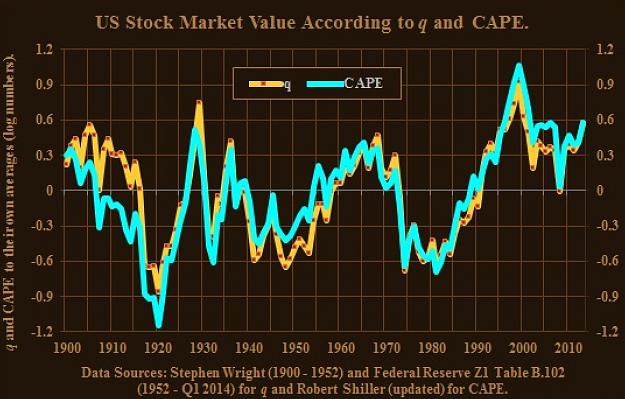
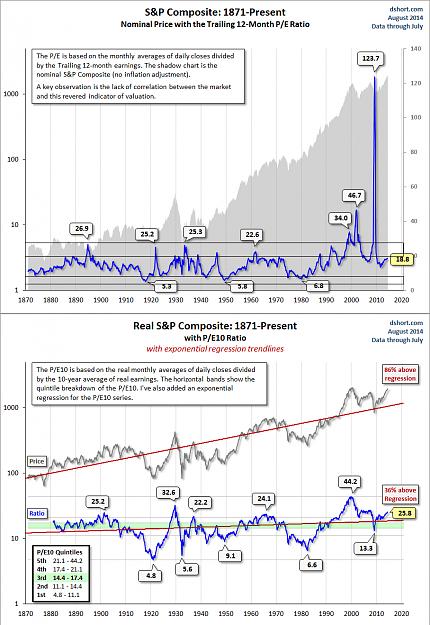
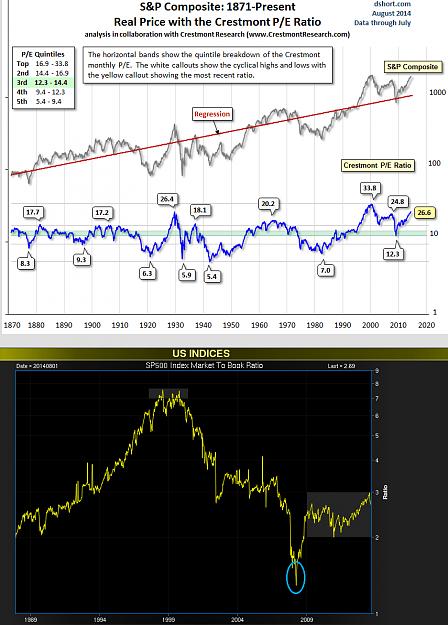
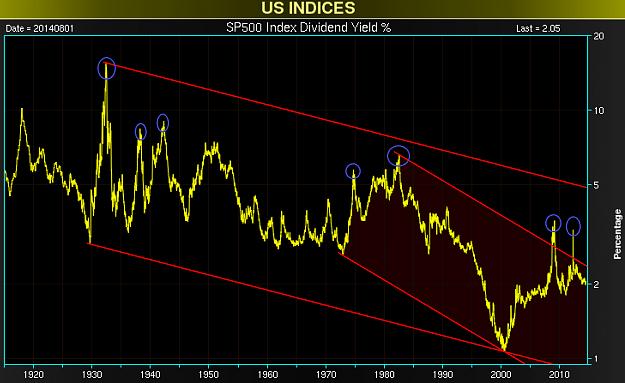
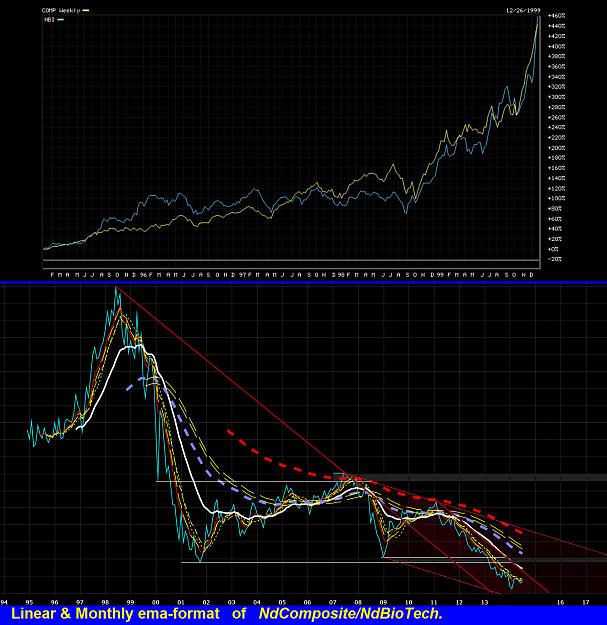
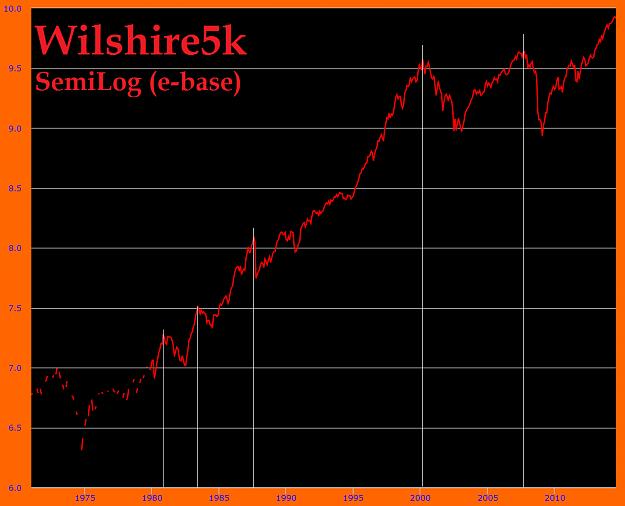
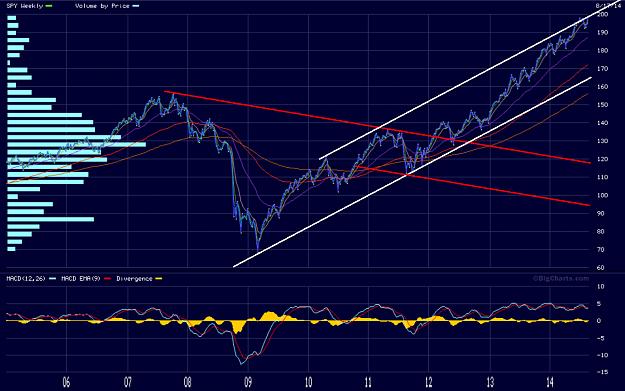
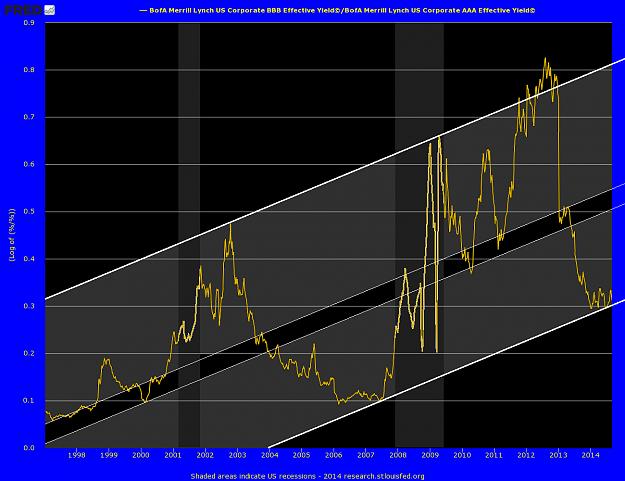
From an historical poin of view, we are in a very impressive phase of S&P500 values (inflation-adj.) above the regression trend (see the duration of last period and also see the triple peaks post 1999 !!!).
Current values are in line with the previous hysterical tops and a little below the 88% of recent secondary top.
According to the distance (or statistical variance) from the regression trend, the US stocks-market is overvalued.
But it is possible a new Sky��Rocket phase above the 88%, because of the unprecedented level of ad-libitum liquidity in the financial ecosistems.
Chart sources.
❖ AdvisorPerspectives.
Sorry for my bad English. I hope that this post is at least minimally useful.
Tuned on main trend, but follows short-medium term signs from underlying prices, for a correct & real-time set-up.
It is very important do not anticipate the main trend of the underlying financial instruments.
☻/♪ ❖ EARTH.pk, Alert 2.O !!! ❖
/▌
/|
I.M.O. by Sa!Vi ►►♥
#KèSaddhaPhàPéKampà: #BundaBunda €MP¥R€ ❣!!!❣
Attached Image (click to enlarge)