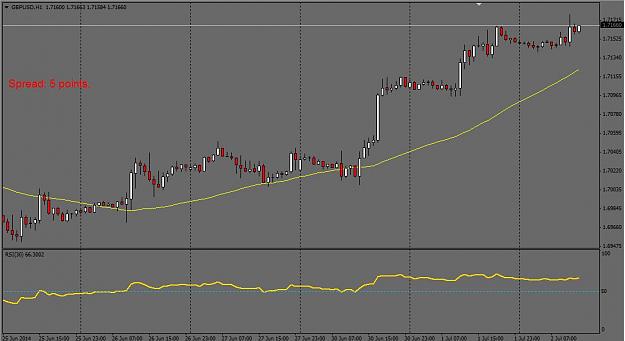
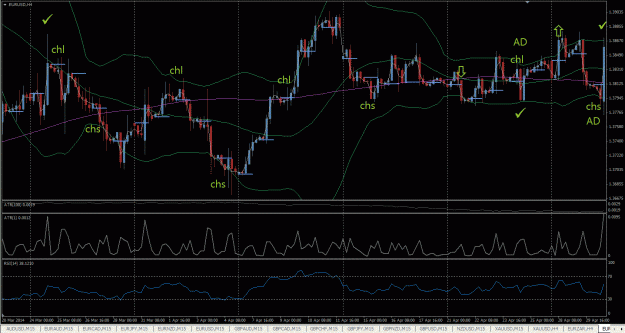
Here's what I got from a friend.
He set up his charts like this:
BB 50, 0.2
SMA 50
RSI(30)
TF 1h
Whenever the price is above SMA 50 "and" RSI(30) -bullish
If price is below SMA 50 and RSI (30) - bearish
This is called the KISS OF MA50, because every time PA reaches 50MA, it is where you'll decide whether to BUY/SELL
TP or SL is set in accordance to the TRENDLINE break.
Good luck!
Comments of your experiences and observations welcome.
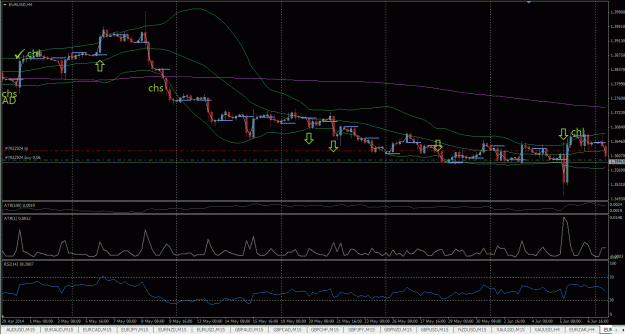
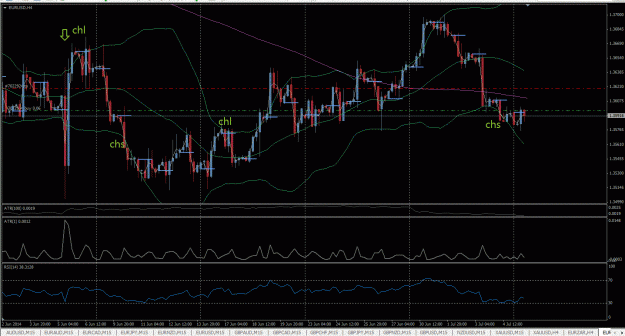
Attached Image (click to enlarge)