- A brief history of my trading:
I opened up charts for the first time with the intention of placing intraday trades roughly two years ago. Since then, it has been one helluva rollercoaster - this system to that system, to this method, to that method, changing colors, indicators, settings weekly, if not daily. I had several stretches of profitability (weeks to 2 months max) before blowing it all on one or two trades I refused to lose on. And then, of course, back to the drawing board. I didn't stop to think about it till about a year in that the real issue was not the methods [as any trader can tell you], but with me: my discipline and my emotional stability.
My first mentor told me that horizontal lines and price were all I needed to trade profitably. Unfortunately, he did not provide me with much help beyond that. However, his comments made a lasting impression that have somewhat haunted me through most of my journey - I felt as if using anything more was "improper" or "amateur". It took me a long time to realize [and at times I still overthink it] that it doesn't matter what your charts look like as long as it makes you money. So I now have several indicators on my charts which are really just there to introduce an easily recognizable level of consistency. Horizontal lines (a.k.a. support and resistance) still play an important part in my trading, but my mind has allowed other things into my trading to help guide me.
I've traded multiple futures contracts (6E, YM, ES, NQ, CL, TF, ZB) as well as focused on several currencies pairs at different times in this journey so far. My second mentor, however, exclusively traded the euro spot market, and after following his trading, and watching euro charts for hours and hours and hours, I've always found myself returning to it. I trade the spot euro now (as opposed to 6E) because of the "broker edge" - the first edge you can get in the spot market is that of your broker - the spread they provide and the commission you can get. Commission is negotiable in futures, but the spread is the spread regardless of who you place trades through.
There are countless hours spent staring at charts, sleepless nights kicking myself for my mistakes, moments of utter elation and even more moments of deep, overwhelming and disturbing despair and sadness baked into this journey that I can't begin to describe here. I'm sure others have experienced them - this work, both intellectual and emotional, is why the failure rate is so high, in my opinion. It's not a matter of whether someone can do it or not: its a matter of persevering through all the long hours and pain to get there. Most people won't do it, but I can't not do it.
- My general thoughts on trading:
I have studied just about every technical practitioner's methods. I'm well versed enough to make you think I could profitably trade by all of the following well known methodologies/theories/practicums: Sam Seiden's supply and demand, Tom Williams' volume spread analysis, Al Brooks, Richard Wyckoff, Peter Steidlmayer and other Auction Market theorists. However, I can't.
I have studied just about every indicator-based system ever posted on Forex Factory, Trader's Lab, Elitetrader, and a handful of other sites, and they all brought me to the same conclusion: that pretty much every price based indicator is identical to every other one and they can all be summarized by simply using price's relation to a moving average.
Further, I realized that I could not follow a system or methodology other than my own, built from all that I've tried and all that I've learned. And what have I learned? The following summarizes it:
Markets are nothing more than an auction, a search for value. Trader's place trades, each offsetting the other in the process of searching for this value. In doing so, they form ranges of price perceived to be "fair value" for whatever reason. Ultimately, something spurs either buyers to want to buy more or sellers to sell more and price trends from its last "value" [from here own known as range] to its next range. These are the two states of the market: ranging or trending.
Trends will discontinue once all willing buyers, for an uptrend, or all willing sellers, for a downtrend, have exhausted themselves. At this point, price must fall to find more willing buyers (end of an uptrend), or it must rise to find more sellers (end of downtrend). How is this useful?
Its useful in determining your entry point. There are only three entries into the market - retracements, reversals, or breakouts. Retracements occur during a trend or following a breakout. Reversals and breakouts both occur at the edges of ranges. There are two ways of entering into retracements and reversals, fading or on confirmation. Breakouts by nature require a confirmation as something has to be "broken". Therefore you are left with a total of 5 possible entry types: fade retracements, confirmation retracements, fade reversals, confirmation reversals, and breakouts.
I do not trade breakouts, in at least as I define them, but will trade breakout retracements. [We could get nitpicky and claim that as I do trade range bars, and often use the close of the range bar in a certain direction as the trigger for the entry, that I am trading a breakout of that range bar's range - I don't see it this way, but rather as a minimum acceptable move in the direction I am trading to be counted as "confirmation".] In essence the breakout is then simply a retracement after the trend starts. So I have four trades that I take that I will define in more detail later: fade & confirmation retracements, fade & confirmation reversals.
- My trading plan, chart setups, and goals
General plan guidelines are as follows: I trade the EU primarily, with a secondary focus on either GU or AU from 5:30am PST to 8:00am PST (8:30am to 11:00am EST). I will trade to achieve a daily goal and stop once hitting it (20 pips). I will not attempt to trade outside my ability, but rather use leverage within my capabilities to grow my account. I have a daily loss limit of 1.5 times my daily profit goal.
As mentioned above, I have four types of entries, but several variants of each as described below [some details will be expanded further later]. Each is given a classification for two reasons: one, to provide a point of reference as I face the charts each morning and, two, so I can maintain individual statistics on each trade type. If for no other reason, the process of labeling my trade types in my daily spreadsheet forces me to review and reflect on the trades I took. Trade types in bold will be my "bread and butter". All trades trigger from the range bar chart, unless otherwise noted.
- Retracement Trades:
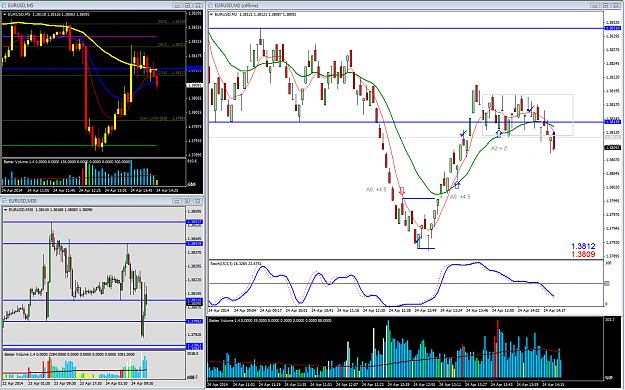
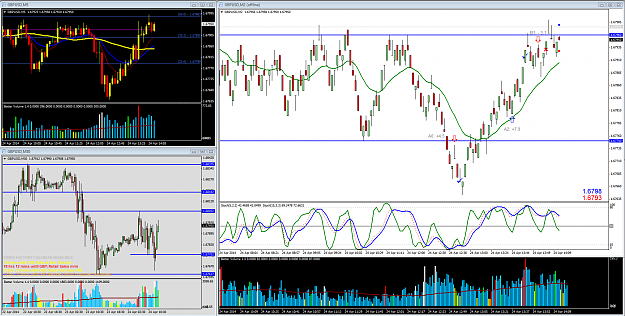
- A0: First pullback after a change of trend or range break. Confirmation trigger.
- A1: All subsequent pullbacks after a change of trend - close beyond trend line of pullback required. Confirmation trigger.
- A2: Pullback to support or resistance with micro DB or DT / micro 2b / micro LH or HL. Confirmation trigger.
- A2f: Pullback to broken support or resistance. Fade trigger.
- Trend will be discussed further. These are all, by nature, with trend trades.
- Reversal Trades:
- B1: micro DT/DB or HL/LH at previous support or resistance. Confirmation trigger.
- 2B1: micro 2b at previous support or resistance or larger 2B. Confirmation trigger.
- PF: (price level trade fade) no confirmation trade taken at 30M or high support or resistance. Fade trigger.
- CF: (calculated level trade fade) no confirmation trade taken at pivots, fibs, 5M 50SMA. Fade trigger.
- Fade level trades require adequate "stretch" into the level, i.e. fast moving market into the level of interest. These are all, by nature, countertrend trades.
Trade Management:
- My first target is always +4.5 pips on any trade. However, on countertrend trades I may pull this tighter and on trend trades I may extend this. This is where there is some discretion. Also, on trend trades I can elect to exit half at my first target and hold the remainder as a runner - again this depends on market volatility.
- My initial stop on all trades is 4.5 pips. However, on trend trades I may pull this back to 6 pips, if there is heightened volatility (i.e. price is bouncing around a bit more - if its not, there is no reason to widen the stop).
- Other causes for exits:
- Two range bars against position on countertrend trade.
- Two failed attempts to advance on trend trades following entry.
- Upcoming news (exit not less than 15 seconds prior to announcement).
- Upcoming support or resistance level from any chart.
Charts:
- My charts are sort of a melting pot of everything I've used at one point or another, gathered from the various sources listed above. Each of them serves a purpose to me, and in one way or another, work together to form the picture of what I want to see.
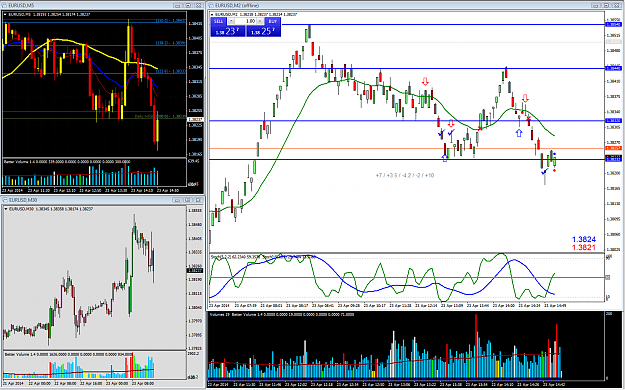
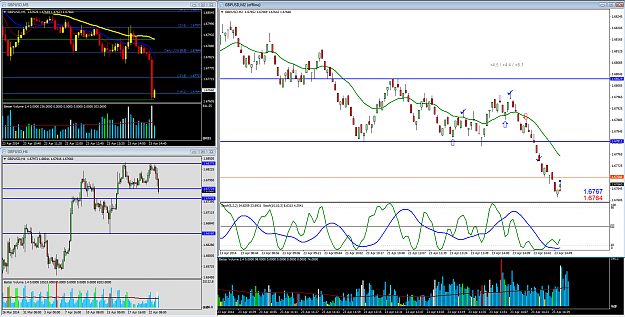
- 30M (or higher) candle chart: This chart is used for a market overview. It provides some hint of larger time frame trends. I primarily use it, however, to mark potential support or resistance that I will either exit a runner at and/or fade. I do not generally use it for determining "my" trend as I find that the larger bar interval trends are largely irrelevant for the trades I am looking for.
- 5M candle chart: This chart is a throwback to the Phil Nell days when I first start reading about forex here on FF. One mentor of mine used/uses it as well as his primary determinant of trend: above or below the 50SMA. I use it for that as well. The space between the faster EMAs also provide a "zone" from which I like to take trend trades as well. And I also keep fibs drawn on yesterday's range as well as pivots on this chart as potential exhaustion points to take countertrend fades at. The volume on this chart also helps warn of potential climactic ends of trend, in which case I will stop looking for A1 trend trades in the current direction, and look for an B countertrend trades or A0 in the opposite direction on the range bar chart.
- 3 Range candle chart: This is my primary entry trigger chart for confirmation trades. I find that intraday support and resistance, intraday ranges, and intraday trends are the most clearly defined on this chart. Further, the range bar's provide an easy trigger for confirmations, especially given that the close of the range bar can be "forecast" prior to closing. This means I can place stop orders (if I have the time) or just be prepared to enter at the forecasted price. I used to use a combination of stochastics on this chart - one to show trend, one to show pullbacks, but I am finding them mostly irrelevant. Price's relation to the 21 EMA on this chart is typically what I refer to when I mean trend.
- 1M chart, volume only: Below the range chart, I keep volume from the 1 minute chart. Volume I have found is primarily useless on the range bar chart, but I do like to watch it on the small time frames. Placing it behind the range bar chart gives me an easy glance to see the amount of interest at a given location.
- 1 Price Change line chart: I also watch a 1 price change line chart to pinpoint support or resistance and to take pullback trades from during hard trends (when these occur).
- My goal for my journal
Really, the purpose of this journal will be just a way for me to record my forex transactions and remain accountable to my business plan. Putting it online allows me to access records of my trades anywhere, anytime as well as allows for input from others that may see weaknesses I am not addressing, as well as share my thoughts with those that might still be struggling.
- Some Resources that have been of help to me: