Chapter 1
Introduction
In this topic we'll discuss about a trading system which involves trading using only two pivot levels.
But first, let's define them.
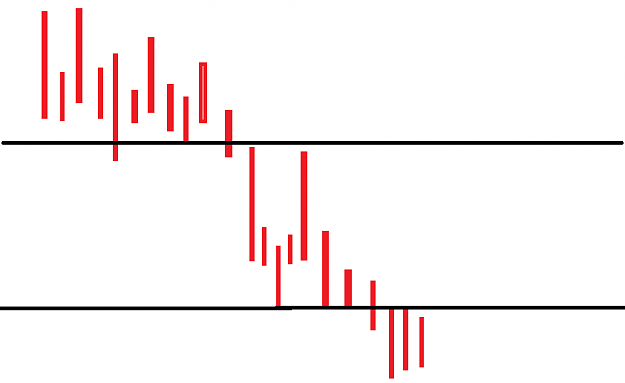
As you already may know, the pivot levels are these support and resistance levels which, according with the variation of the price, they switch from a category to another. (example: the transition from a support level to a resistance level). As an example, I took randomly a Gold chart on the daily time frame, it's not important which time frame do you use and we can see how on three different ocassions, the precious metal tried to push over the 993.00 level, where the resistance level was situated. At this point the level was strong, but soon after that the price tried to break it once again and succeeded, and that level was used as a point of leverage for the upside movement which was nesting, the 993.00 level became then a pivot level.
Conclusion: a support which becomes resistance (or vice versa) is a pivot level.
Always, there was an important problem regarding the positioning of the price into a category which is called: range or sideways and when the price strives to move from one direction to another, into a constant limited range.
Trading using two pivot levels is coming to solve this dilemma.
Construction
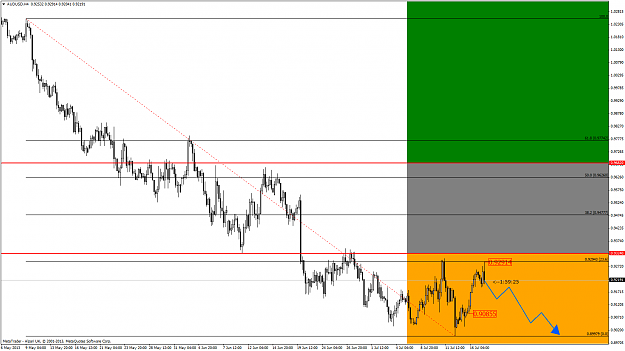
For starters, you need to determine (on any given chart) the two most important pivot levels. We need to build only two horizontal lines for that. The ultimate goal of this is to have a system which define for you in a very precise manner if there is a trend or not or future warnings regarding the possible shifting in trend or an entry into a possible messy correction phase or sideways market.
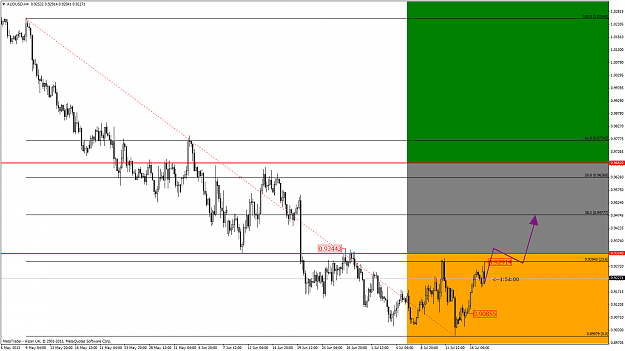
In the example below, on the AUD/CHF pair, we established two pivotal values on the 0.9850 level and respectively - 0.9473 level.
To do that you don't have to zoom out too much into the past price action, I did it in the upper example only to highlight and make you understand properly, these areas and you need to do that when the price action is lacking it's clarity or there exists relevant support and resistance areas, for marking.But these situations are rare.
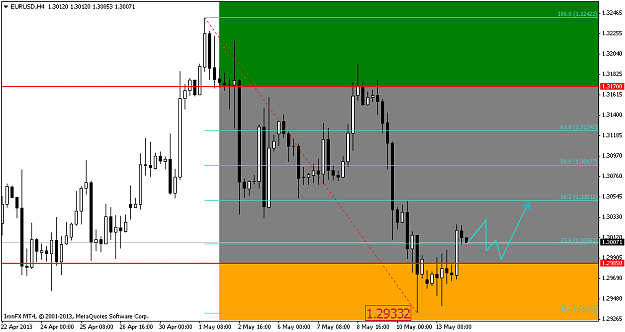
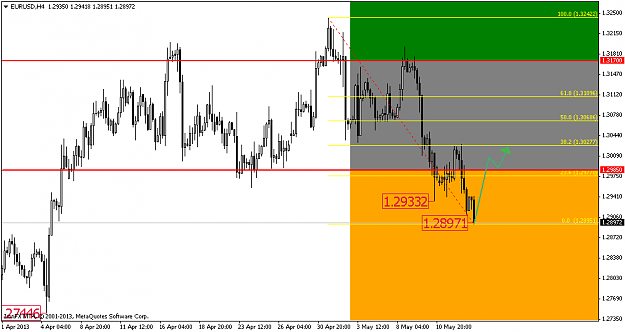
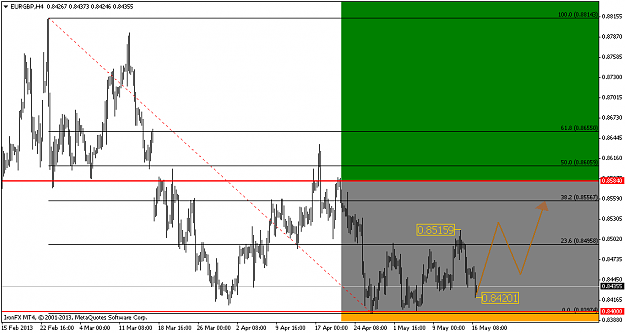
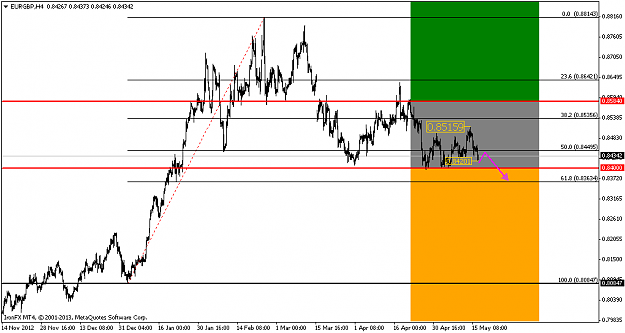
Now, after drawing them, we have three important zones or biases, as follows:
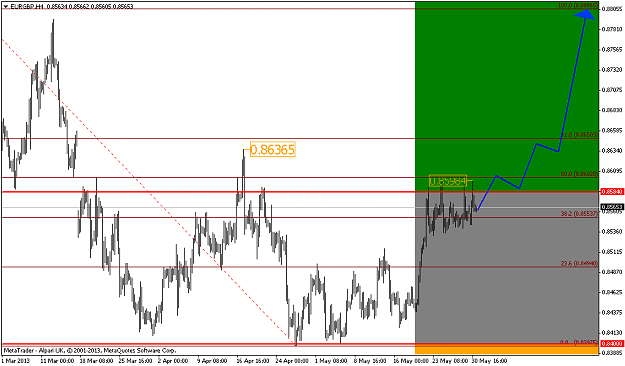
1. Upside bias
If the price is above the pivot which has the highest value - the bias is up (green colored zone).
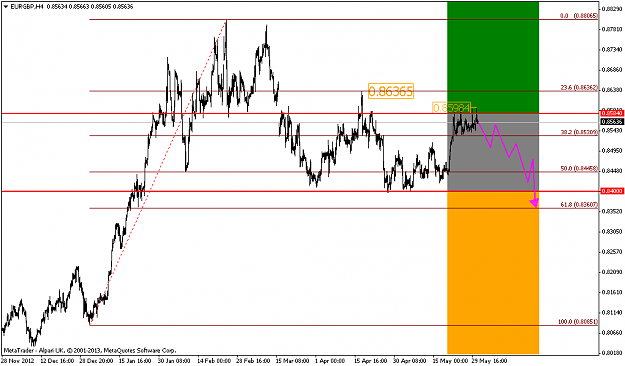
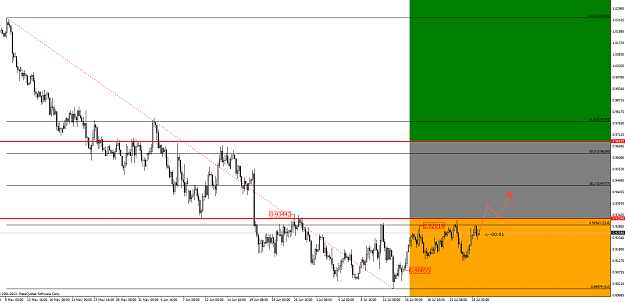
2. Neutral bias
If the price is situated between the two pivot levels - the bias is neutral. (grey colored zone)
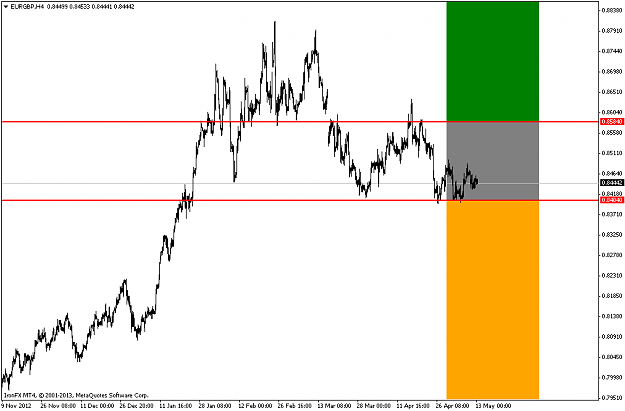
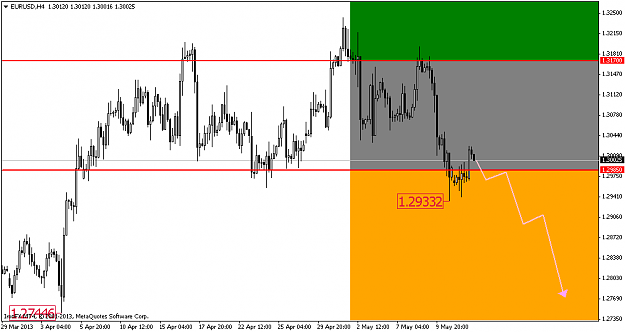
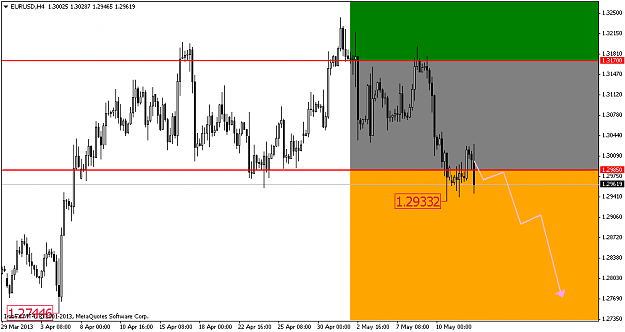
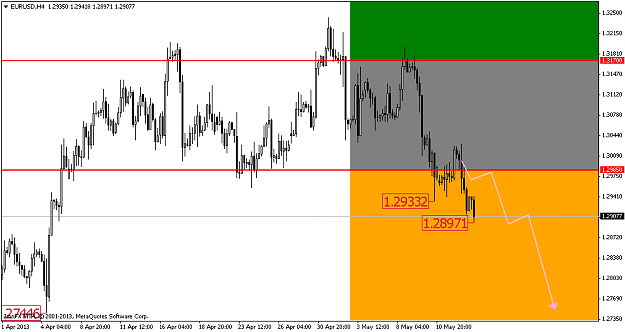
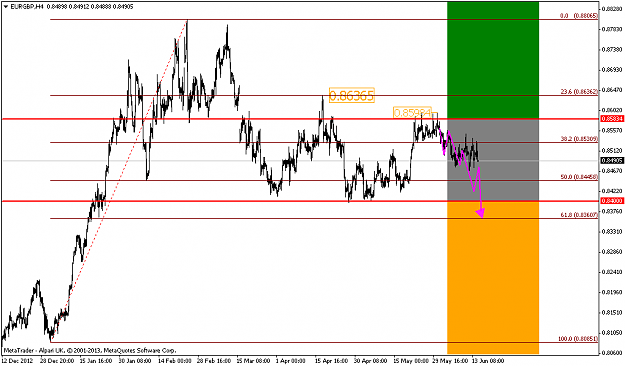
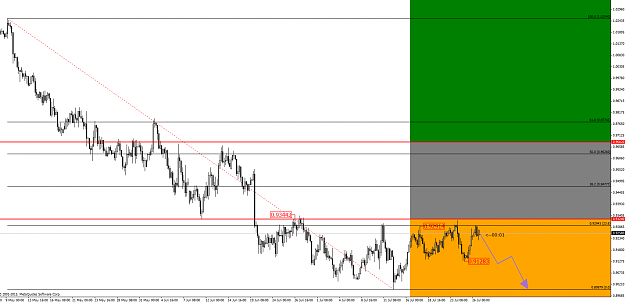
3. Downside bias
If the price is situated below the lowest pivot level - the bias is down. (orange colored zone)
These areas are drawn manually with this indicator, with green (for up bias), gray (for neutral bias) and orange (down bias). When using it, needs to be installed on each time frame do you like, not for all of them simultaneously, because the positioning of the pivot levels will change for every time frame.
Characteristics
Both upside and downside bias implies potential ferm or even aggressive moves which could lead to fresh historical lows, when positioning in the downside bias or to go to fresh highs, when the price is positioning in the downside bias.
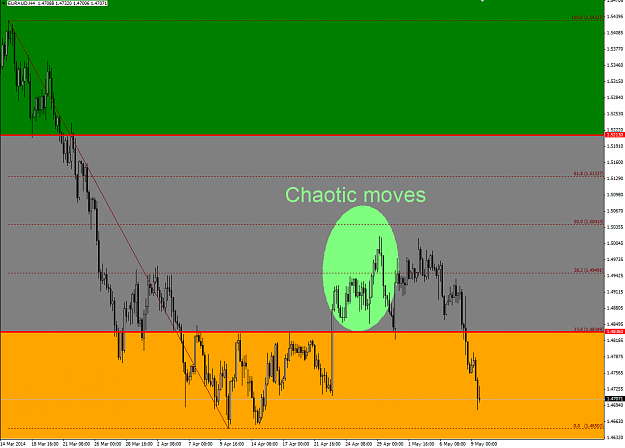
When the price breaks any pivot level and enters in the neutral bias, this action should be watched with caution, because the positioning in this particular case may entail with losses, because the price could correct very little, or to be a fake break or even the nature of the correction to be irregular and chaotic.
Just watch below the reaction of the EUR/AUD currency pair, when broke the 1.4848 pivot level. Up and downs like a spinner.
Among the advantages, trading only the upside and downside biases, are:
- there is a higher degree of certanty, regarding hitting the targets
- there is a little roomier of stop-losses, and the price can breath and consolidate before bursting into an impulsive trend move
- there are better risk ratio in the upside and downside bias cases than in the neutral
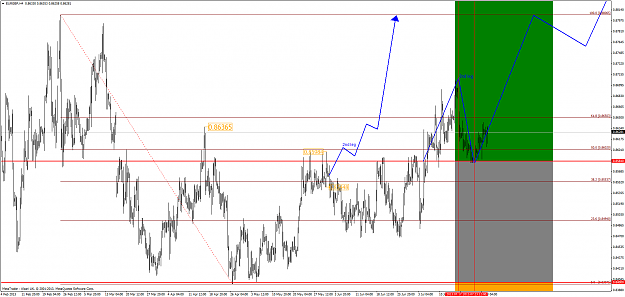
Upside bias on EUR/AUD
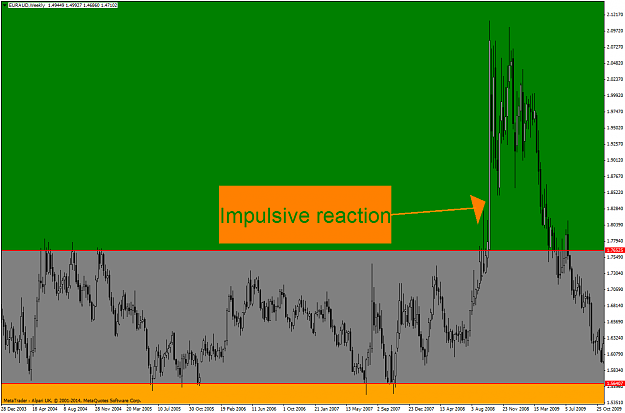
This movement occurs over the aftermath of the global central banks cut interest rates simultaneously, the news ise here.
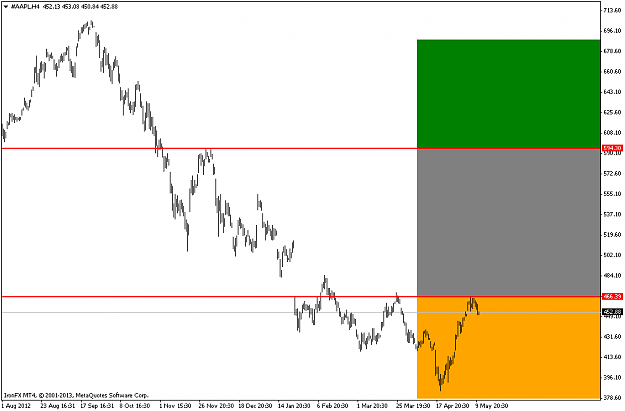
Downside bias on Nasdaq
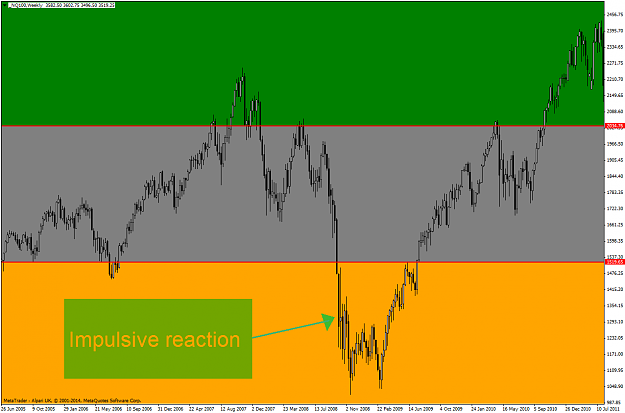
And this move has happened in the weeks after the Lehman Brothers collapse, the news are here.
Chapter 2 has been created and can be found in the post now, on post no.66.
Introduction
In this topic we'll discuss about a trading system which involves trading using only two pivot levels.
But first, let's define them.
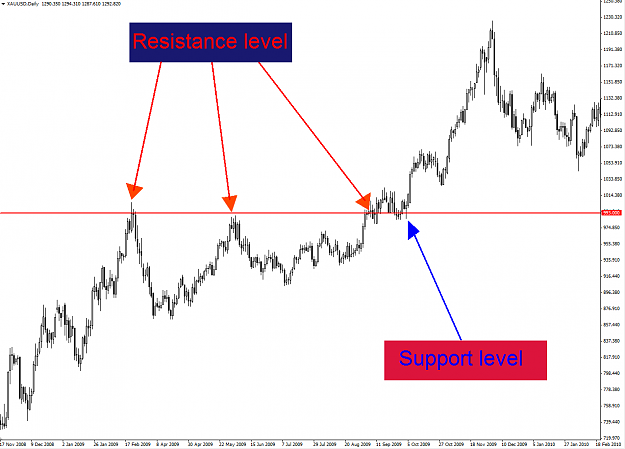
As you already may know, the pivot levels are these support and resistance levels which, according with the variation of the price, they switch from a category to another. (example: the transition from a support level to a resistance level). As an example, I took randomly a Gold chart on the daily time frame, it's not important which time frame do you use and we can see how on three different ocassions, the precious metal tried to push over the 993.00 level, where the resistance level was situated. At this point the level was strong, but soon after that the price tried to break it once again and succeeded, and that level was used as a point of leverage for the upside movement which was nesting, the 993.00 level became then a pivot level.
Attached Image (click to enlarge)
Conclusion: a support which becomes resistance (or vice versa) is a pivot level.
Always, there was an important problem regarding the positioning of the price into a category which is called: range or sideways and when the price strives to move from one direction to another, into a constant limited range.
Trading using two pivot levels is coming to solve this dilemma.
Construction
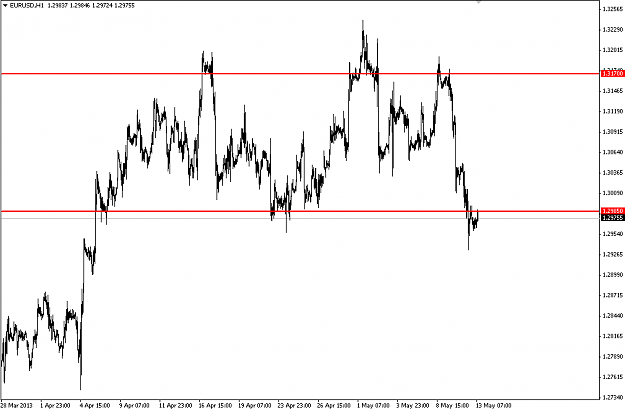
For starters, you need to determine (on any given chart) the two most important pivot levels. We need to build only two horizontal lines for that. The ultimate goal of this is to have a system which define for you in a very precise manner if there is a trend or not or future warnings regarding the possible shifting in trend or an entry into a possible messy correction phase or sideways market.
In the example below, on the AUD/CHF pair, we established two pivotal values on the 0.9850 level and respectively - 0.9473 level.
Attached Image (click to enlarge)
To do that you don't have to zoom out too much into the past price action, I did it in the upper example only to highlight and make you understand properly, these areas and you need to do that when the price action is lacking it's clarity or there exists relevant support and resistance areas, for marking.But these situations are rare.
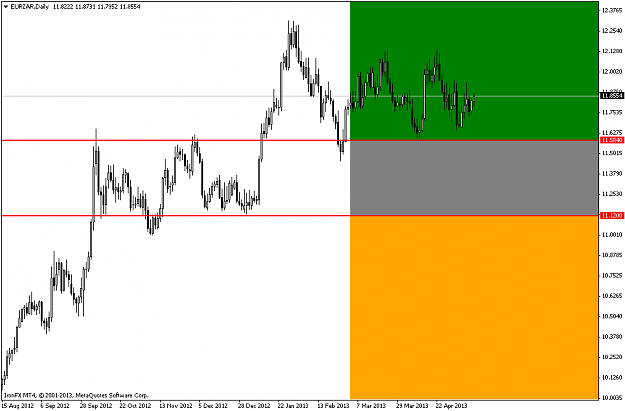
Now, after drawing them, we have three important zones or biases, as follows:
1. Upside bias
If the price is above the pivot which has the highest value - the bias is up (green colored zone).
Attached Image (click to enlarge)
2. Neutral bias
If the price is situated between the two pivot levels - the bias is neutral. (grey colored zone)
Attached Image (click to enlarge)
3. Downside bias
If the price is situated below the lowest pivot level - the bias is down. (orange colored zone)
Attached Image (click to enlarge)
These areas are drawn manually with this indicator, with green (for up bias), gray (for neutral bias) and orange (down bias). When using it, needs to be installed on each time frame do you like, not for all of them simultaneously, because the positioning of the pivot levels will change for every time frame.
Attached File(s)
Characteristics
Both upside and downside bias implies potential ferm or even aggressive moves which could lead to fresh historical lows, when positioning in the downside bias or to go to fresh highs, when the price is positioning in the downside bias.
When the price breaks any pivot level and enters in the neutral bias, this action should be watched with caution, because the positioning in this particular case may entail with losses, because the price could correct very little, or to be a fake break or even the nature of the correction to be irregular and chaotic.
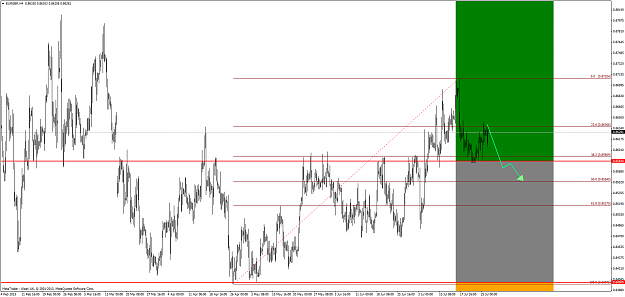
Just watch below the reaction of the EUR/AUD currency pair, when broke the 1.4848 pivot level. Up and downs like a spinner.
Attached Image (click to enlarge)
Among the advantages, trading only the upside and downside biases, are:
- there is a higher degree of certanty, regarding hitting the targets
- there is a little roomier of stop-losses, and the price can breath and consolidate before bursting into an impulsive trend move
- there are better risk ratio in the upside and downside bias cases than in the neutral
Upside bias on EUR/AUD
Attached Image (click to enlarge)
This movement occurs over the aftermath of the global central banks cut interest rates simultaneously, the news ise here.
Downside bias on Nasdaq
Attached Image (click to enlarge)
And this move has happened in the weeks after the Lehman Brothers collapse, the news are here.
Chapter 2 has been created and can be found in the post now, on post no.66.