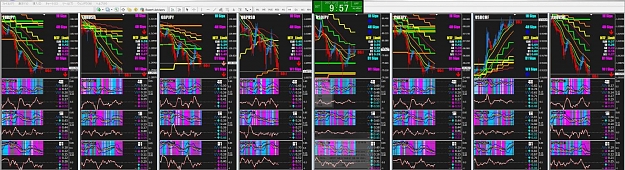
The red and blue looks like heiken ashi candle. And there are clearly some moving averages.
But I'm really interested in the "MTF_Limit" information on the right and the two range indicators in the main window... looks like some kind of daily/weekly pivot?
Thanks!
*edit - looks like ffactory compressed it when I uploaded it. Here's the full version: http://i.imgur.com/3N23Q.jpg
But I'm really interested in the "MTF_Limit" information on the right and the two range indicators in the main window... looks like some kind of daily/weekly pivot?
Thanks!
*edit - looks like ffactory compressed it when I uploaded it. Here's the full version: http://i.imgur.com/3N23Q.jpg
Attached Image (click to enlarge)