CCiPP - CCi Price Prediction
Dear Traders,
I would like to share with you my strategy for trading the CCi. I use it for predicting the price. Sounds interesting? Yes it is interesting. I will show you a few examples how to trade successfully with this system, using TP for all of your trades!
But! I will need your help too! I would like to ask you to join into this thread and trade this system and put your charts in so we can share our ideas experiences. It might happen that we find out even better patterns and techniques to find more trades.
This system has not too much of trades, but can be used on any pair and I would say any Time-Frame, however, to get a serious profit, I reccomend using an H1/H4 time frame. It works well on daily too but has very few trades and the volatility of a candle can be huge.
But enough of talk lets go down to the business.
So here are the Rules.
All you need, is a clean and visible chart, with the CCi 14 - using the "Price Close" calculation.
The next thing is to look for divergences. What is a divergence? When the price move against of the indicator, but you will see it on my charts below.
You need some settings for the CCi - Set horizontal lines for its spectrum - You will need the +/- 200, +/- 150, +/ -50 and the 0.
To make it faster for you I have attached a template file so you do not have to bother your self setting all of this.
So, how I look for a trade. I need a Extreme High or Low on the CCi, this means above or below +/-200. Then I have to wait until my CCi goes to the +/- 50, it does not matter where my price is. From this point I need my CCi to go back to extreme. The best is if the CCi goes above or below +/- 150 on the CCi. At this point my price must be in a Divergence. With my Lower High or Low (+/- 150). My price must have a Higher High or a Lower Low.
That is where I step into my trade. Where is the TP? You may ask after reading the title of this topic. The TP is where my Divergence started. The close of that Candle where my first Extreme high or Low was seen. But if you take a look on the chart you will see.
The Stop Loss? That is depending on your own judgment but I recommend a stoploss of 1/3 of the TP. So If my price is 100 pip away from my TP then I set a SL of 30 pips. Its up to you how many risk you take with your Lots.
And now comes the hardest part. So we have the rules how and when to step in, but we do not have that part when not to step into the trade.
Criterias:
- If my price did not touched or was not over the +/- 50
- If between my two highs or lows the CCi went over or touched the 0 line
* I would say that that could be a criteria to not to step into the trade if the 2nd Low or High was not close or over the +/- 150 but many times a clean peak or spike in the CCi can be used. I think we should get more experience with this and together find out the best way.
So Lets see some examples.
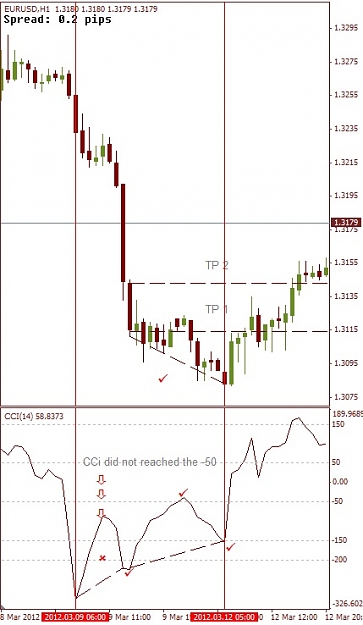
1st Example. A very good example is what you see below. It shows why the criteria are important and what happens if everything matches. You can see too TP levels. The 1st TP1 is the close of the candle where the Diver started. The TP2 is the Opening of the same candle. I recommend a 75% of breakeven of your trades at TP1 and keeping it for a possible reaching of the TP2. Why? Because you are stepping into a divergence that already indicated a price change. And in many cases the price returns to the opening price of the candle. However this is just an option for your breakeven, but our main goal was already reached. Everything after that is just an extra. If it doesn't or returns its direction you can close your 25%, still in profit. I recommend also to put yout TP about 5 pips before your TP, just in case if you might have higher Spread and also for safety reasons.
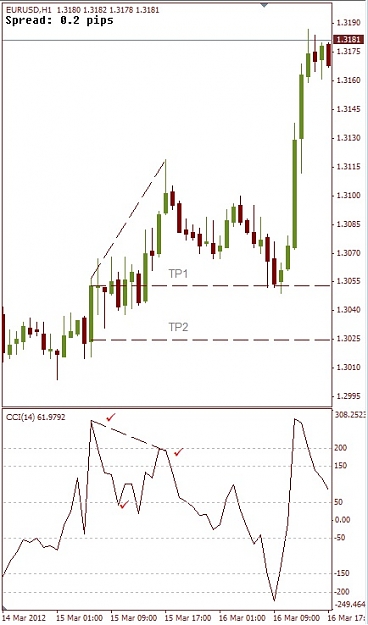
2nd Example: Here you can see another example. It shows that the price has just got back to the same price where the divergence started. As you see TP2 was not hit so that is why I say that TP is just a possible target for the Breakeven. But as you see our main goal has been hit and we are good.
3rd Example: Here you can see an USDCHF chart. It is a similar example as the first one, just to show why it is important to keep our selfs to the criterias.
So that is for today, I will post more examples tomorrow night. For practice, please Download my template and look for these patterns and see for your self how this thing works. I am really interested in your comments.
And one more thing! Please note that you are trading for your own risk. My system is only showing how I trade. If you copy this method, that is only on your risk. And as always, start testing on a DEMO!
!!!!UPDATE!!!!
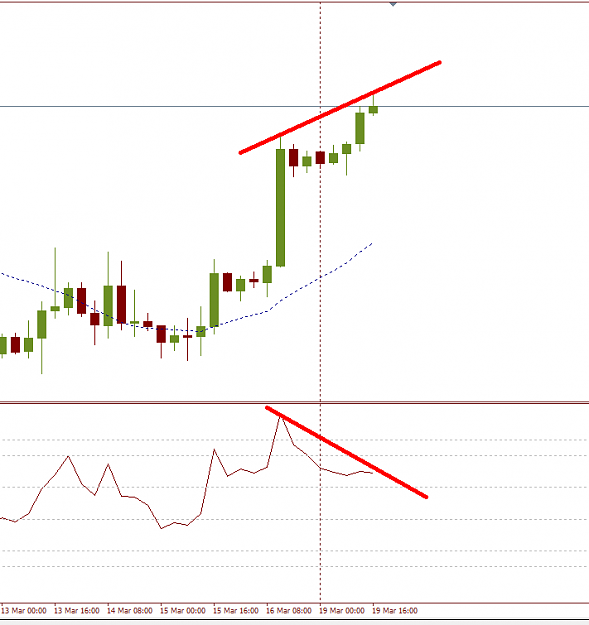
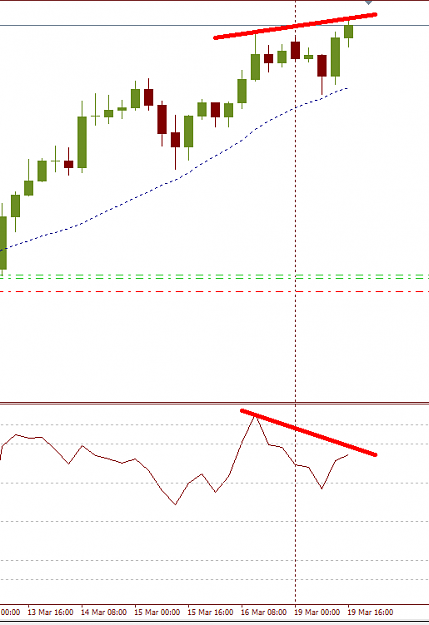
It has been revealed, the for successful patterns you need to see a Hidden Divergence in your pattern that will give a boost to the trend where you are in and that will push up your price to make a new peak, and that peak will be lower because of this divergence!
In case you see between the two peaks convergence that might break the patter. Please see more on Page 2.
Thank you for all you attention
Mihály
Dear Traders,
I would like to share with you my strategy for trading the CCi. I use it for predicting the price. Sounds interesting? Yes it is interesting. I will show you a few examples how to trade successfully with this system, using TP for all of your trades!
But! I will need your help too! I would like to ask you to join into this thread and trade this system and put your charts in so we can share our ideas experiences. It might happen that we find out even better patterns and techniques to find more trades.
This system has not too much of trades, but can be used on any pair and I would say any Time-Frame, however, to get a serious profit, I reccomend using an H1/H4 time frame. It works well on daily too but has very few trades and the volatility of a candle can be huge.
But enough of talk lets go down to the business.
So here are the Rules.
All you need, is a clean and visible chart, with the CCi 14 - using the "Price Close" calculation.
The next thing is to look for divergences. What is a divergence? When the price move against of the indicator, but you will see it on my charts below.
You need some settings for the CCi - Set horizontal lines for its spectrum - You will need the +/- 200, +/- 150, +/ -50 and the 0.
To make it faster for you I have attached a template file so you do not have to bother your self setting all of this.
So, how I look for a trade. I need a Extreme High or Low on the CCi, this means above or below +/-200. Then I have to wait until my CCi goes to the +/- 50, it does not matter where my price is. From this point I need my CCi to go back to extreme. The best is if the CCi goes above or below +/- 150 on the CCi. At this point my price must be in a Divergence. With my Lower High or Low (+/- 150). My price must have a Higher High or a Lower Low.
That is where I step into my trade. Where is the TP? You may ask after reading the title of this topic. The TP is where my Divergence started. The close of that Candle where my first Extreme high or Low was seen. But if you take a look on the chart you will see.
The Stop Loss? That is depending on your own judgment but I recommend a stoploss of 1/3 of the TP. So If my price is 100 pip away from my TP then I set a SL of 30 pips. Its up to you how many risk you take with your Lots.
And now comes the hardest part. So we have the rules how and when to step in, but we do not have that part when not to step into the trade.
Criterias:
- If my price did not touched or was not over the +/- 50
- If between my two highs or lows the CCi went over or touched the 0 line
* I would say that that could be a criteria to not to step into the trade if the 2nd Low or High was not close or over the +/- 150 but many times a clean peak or spike in the CCi can be used. I think we should get more experience with this and together find out the best way.
So Lets see some examples.
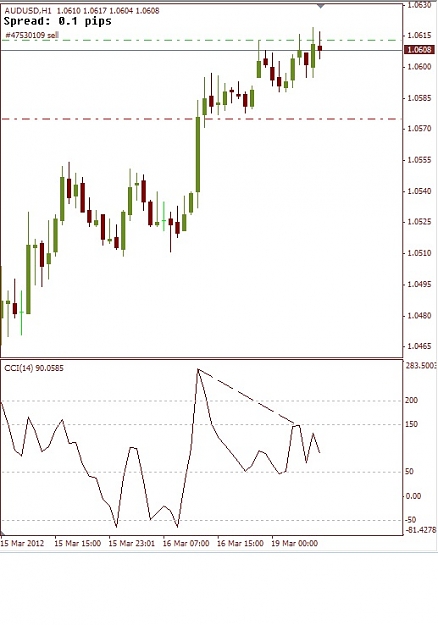
1st Example. A very good example is what you see below. It shows why the criteria are important and what happens if everything matches. You can see too TP levels. The 1st TP1 is the close of the candle where the Diver started. The TP2 is the Opening of the same candle. I recommend a 75% of breakeven of your trades at TP1 and keeping it for a possible reaching of the TP2. Why? Because you are stepping into a divergence that already indicated a price change. And in many cases the price returns to the opening price of the candle. However this is just an option for your breakeven, but our main goal was already reached. Everything after that is just an extra. If it doesn't or returns its direction you can close your 25%, still in profit. I recommend also to put yout TP about 5 pips before your TP, just in case if you might have higher Spread and also for safety reasons.
Attached Image (click to enlarge)
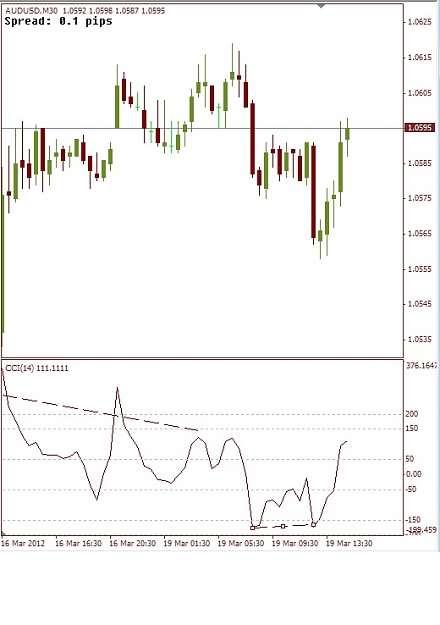
2nd Example: Here you can see another example. It shows that the price has just got back to the same price where the divergence started. As you see TP2 was not hit so that is why I say that TP is just a possible target for the Breakeven. But as you see our main goal has been hit and we are good.
Attached Image (click to enlarge)
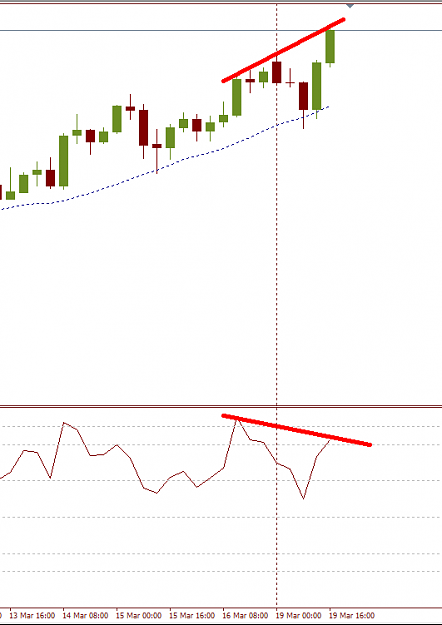
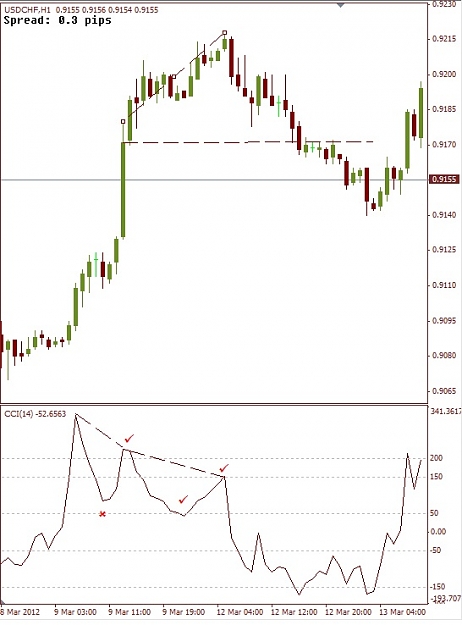
3rd Example: Here you can see an USDCHF chart. It is a similar example as the first one, just to show why it is important to keep our selfs to the criterias.
Attached Image (click to enlarge)
So that is for today, I will post more examples tomorrow night. For practice, please Download my template and look for these patterns and see for your self how this thing works. I am really interested in your comments.
And one more thing! Please note that you are trading for your own risk. My system is only showing how I trade. If you copy this method, that is only on your risk. And as always, start testing on a DEMO!
!!!!UPDATE!!!!
It has been revealed, the for successful patterns you need to see a Hidden Divergence in your pattern that will give a boost to the trend where you are in and that will push up your price to make a new peak, and that peak will be lower because of this divergence!
In case you see between the two peaks convergence that might break the patter. Please see more on Page 2.
Thank you for all you attention
Mihály
Attached File(s)