►►Financial Markets Observatory Lab.◀◀
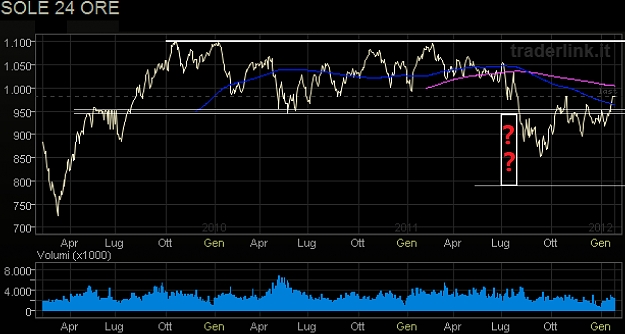
Some notes/charts about Italian Stocks-Benchmarks.
General stocks-benchmarks as follows:
► Italian stocks-benchmarks (FTSE/MIB; IT/DOW; IT/DOW Titan30; IT/MSCI);
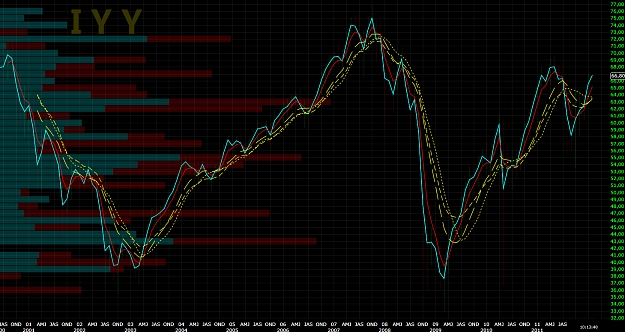
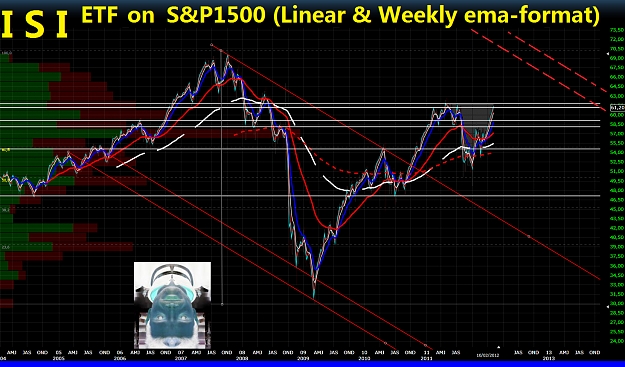
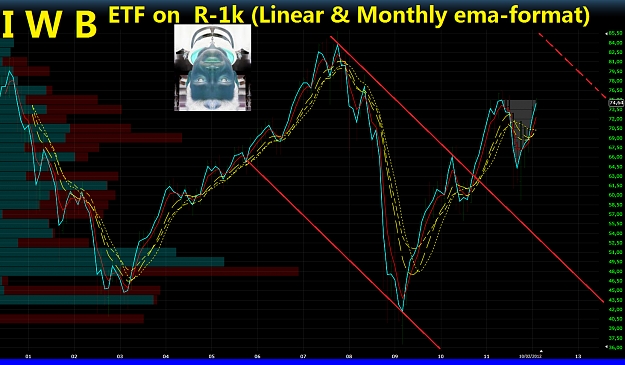
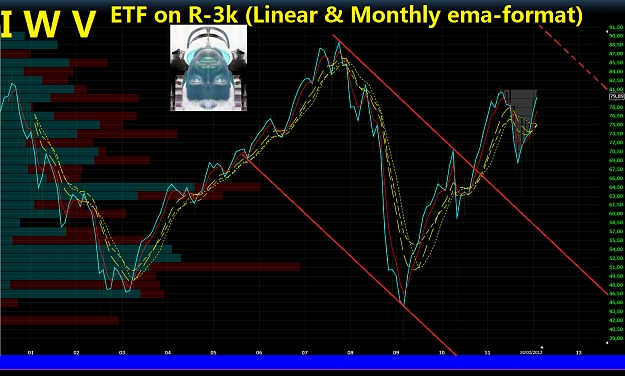
► global U.S. stocks-benchmarks (charts & notes: EUSA; ISI; IWB; IWV; IYY; TMW);
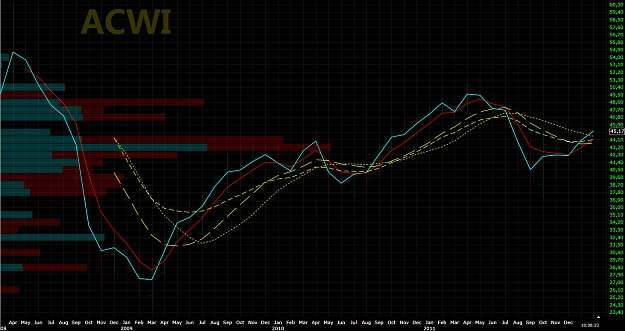
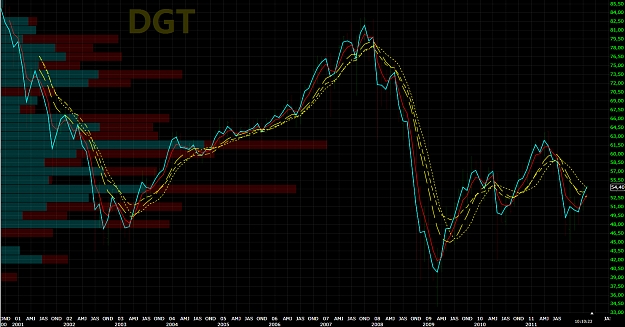
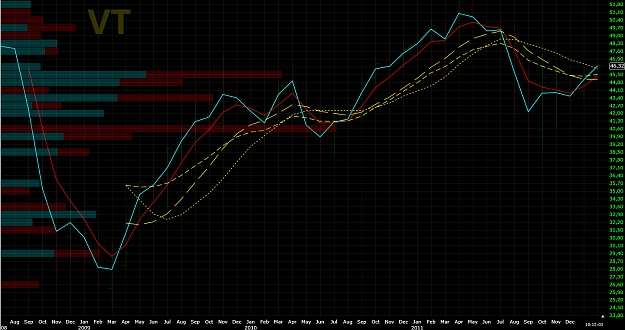
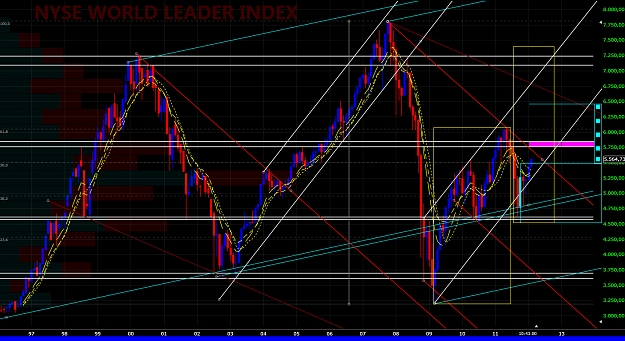
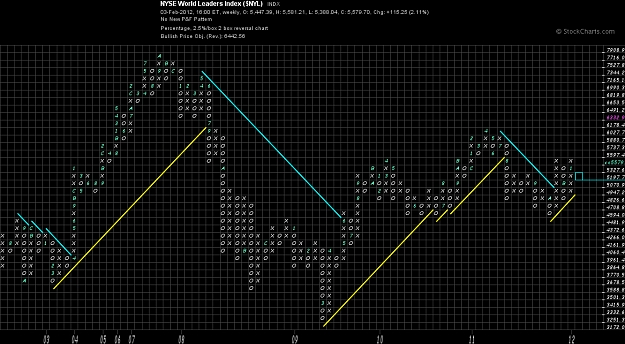
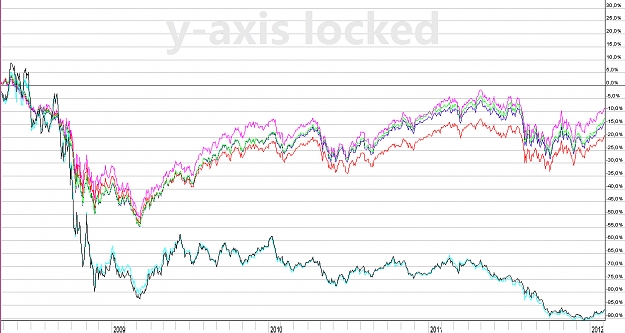
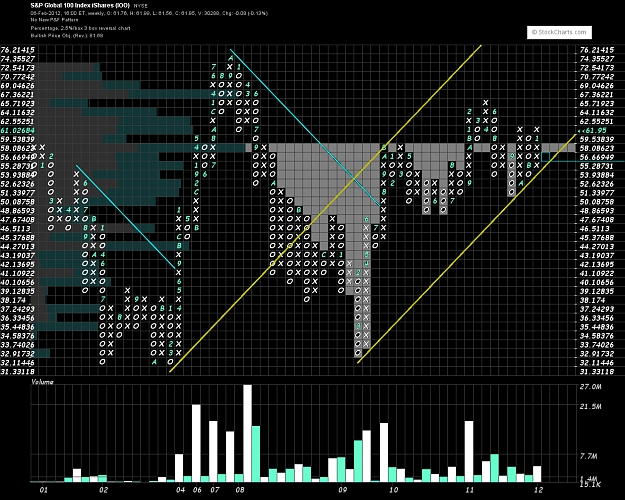
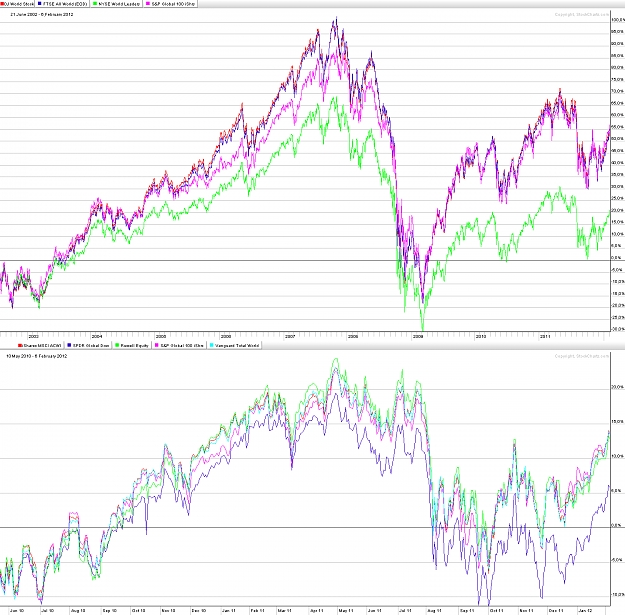
► global World stocks-benchmarks (charts & notes: ACWI; DGT; IOO; NYSE W.L.I.; ONEF; VT).
http://www.bloomberg.com/apps/chart?...I%3AUS&img=png
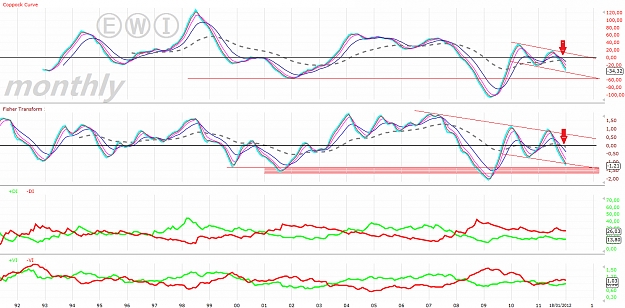
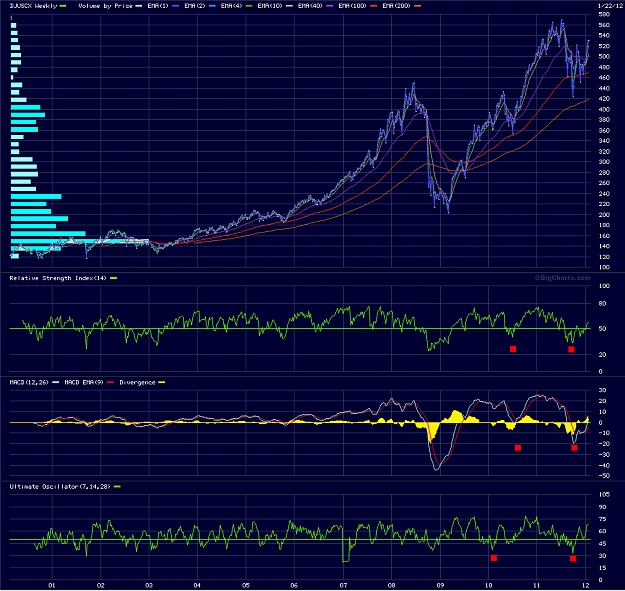
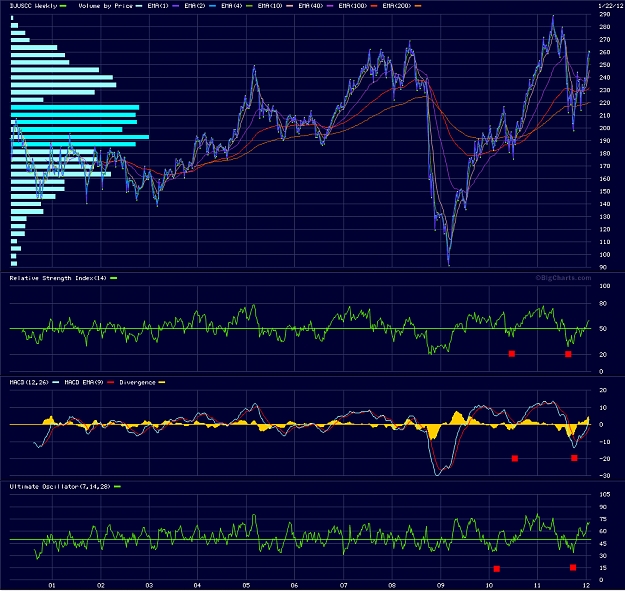
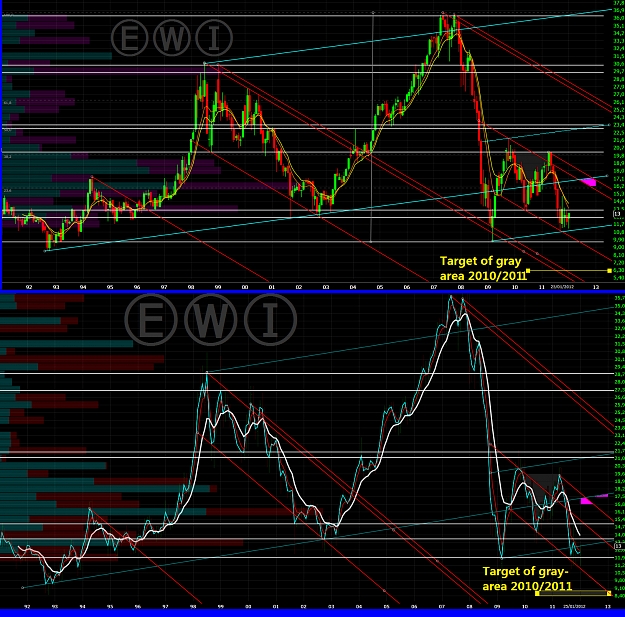
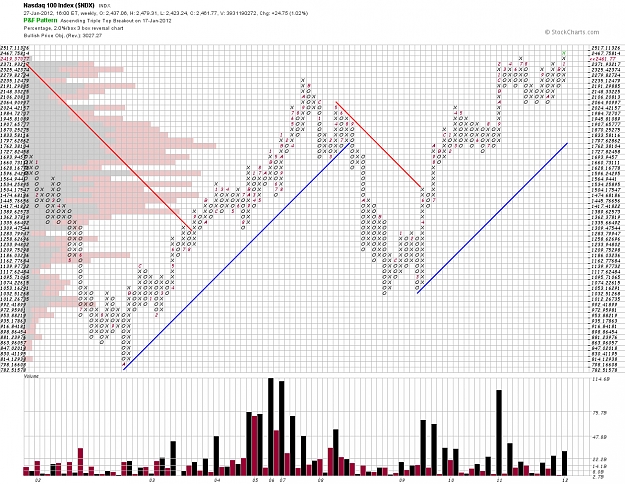
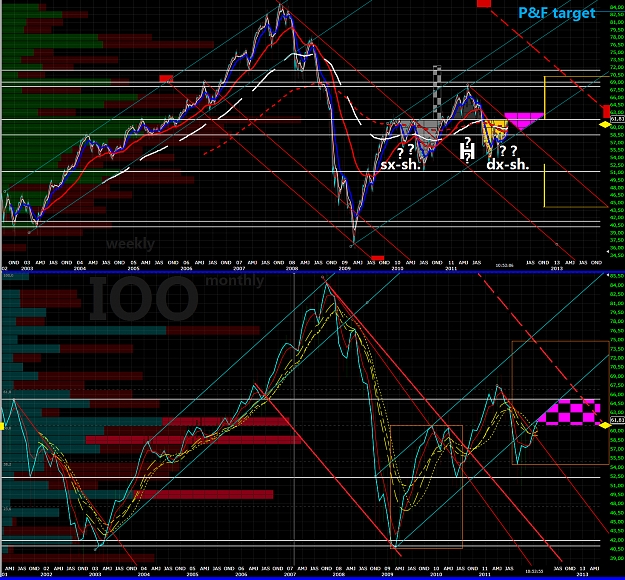
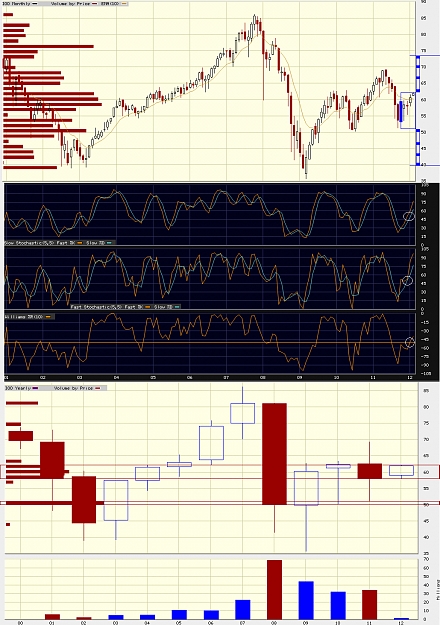
In this post there are two frames (monthly & weekly) for 4 indicators of MSCI Italy EWI.
Monthly.
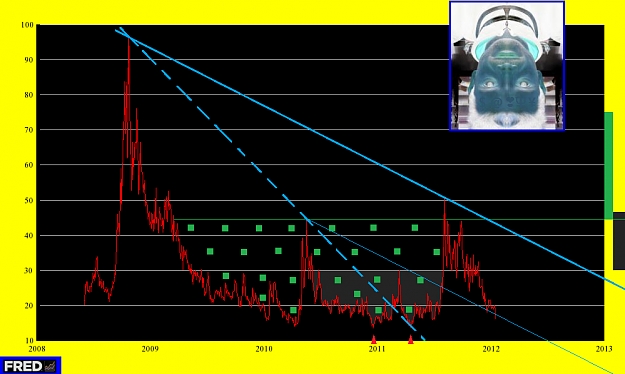
Coppock curve shows: ema in bearish-array; values below 0-line; continuation-bear (2010/2011) inside a descending rectangle and toward 2001/2002 level.
Fisher transform shows: ema in bearish-array; values below 0-line; continuation-bear (2010/2011) inside a descending rectangle and toward 2001/2002 level (in full-test);
D+/D- & Vortex +/- shows: spreads in bearish-array but without reversal signals in actions.
Notes: the benchmark shows important and complete bear-trend in action.
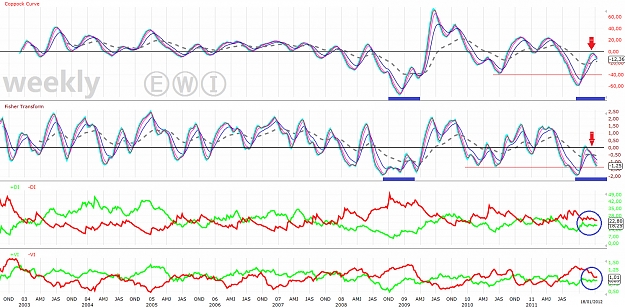
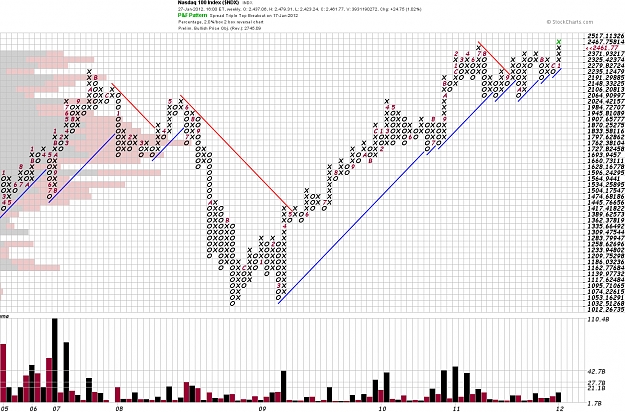
Weekly.
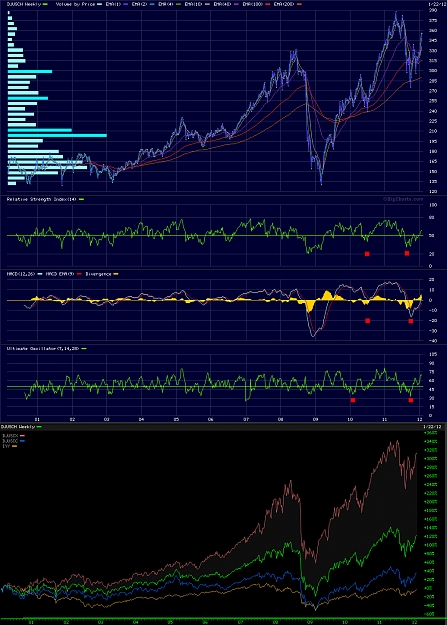
Coppock curve shows: ema in bullish-array from mid-2011, and with pause; values below 0-line; waves structure very similar to 2008/2009, and 2010-lows as critical-level.
Fisher transform shows: ema in bearish-array from mid-2011, but with reversal in bearish-status in autumn; values below 0-line; waves structure very similar to 2008/2009, and 2010-lows as critical-level, now in full-test;
D+/D- & Vortex +/- shows: spreads in important decrease evolution, but without reversal signals in actions.
Notes: the benchmark shows some signs (but not signals) for an attempt of reverseal of secondary trend.
☻/ ۞ Globo.pk 2.0 Alert ۞
/▌
/|
Tuned on main trend, but follows short-medium term signs from underlying prices, for a real-time and correct set-up.
It is very important do not anticipate the main trend of the underlying financial instruments.
K€SADDhAPHA'pe'KAMPA' ℬunda-€MP¥R€ $0UND $¥$T€M$ ❣❣❣
ⒾⓂⓄ ℬϒ $@❣♆¥ ♥ █║▌│█│║▌║▌║ █
  ❤
❤
∞
H! ALL [ bad English, sorry ⊱ : ( ]Some notes/charts about Italian Stocks-Benchmarks.
General stocks-benchmarks as follows:
► Italian stocks-benchmarks (FTSE/MIB; IT/DOW; IT/DOW Titan30; IT/MSCI);
► global U.S. stocks-benchmarks (charts & notes: EUSA; ISI; IWB; IWV; IYY; TMW);
► global World stocks-benchmarks (charts & notes: ACWI; DGT; IOO; NYSE W.L.I.; ONEF; VT).
http://www.bloomberg.com/apps/chart?...I%3AUS&img=png
In this post there are two frames (monthly & weekly) for 4 indicators of MSCI Italy EWI.
Monthly.
Coppock curve shows: ema in bearish-array; values below 0-line; continuation-bear (2010/2011) inside a descending rectangle and toward 2001/2002 level.
Fisher transform shows: ema in bearish-array; values below 0-line; continuation-bear (2010/2011) inside a descending rectangle and toward 2001/2002 level (in full-test);
D+/D- & Vortex +/- shows: spreads in bearish-array but without reversal signals in actions.
Notes: the benchmark shows important and complete bear-trend in action.
Weekly.
Coppock curve shows: ema in bullish-array from mid-2011, and with pause; values below 0-line; waves structure very similar to 2008/2009, and 2010-lows as critical-level.
Fisher transform shows: ema in bearish-array from mid-2011, but with reversal in bearish-status in autumn; values below 0-line; waves structure very similar to 2008/2009, and 2010-lows as critical-level, now in full-test;
D+/D- & Vortex +/- shows: spreads in important decrease evolution, but without reversal signals in actions.
Notes: the benchmark shows some signs (but not signals) for an attempt of reverseal of secondary trend.
☻/ ۞ Globo.pk 2.0 Alert ۞
/▌
/|
Tuned on main trend, but follows short-medium term signs from underlying prices, for a real-time and correct set-up.
It is very important do not anticipate the main trend of the underlying financial instruments.
K€SADDhAPHA'pe'KAMPA' ℬunda-€MP¥R€ $0UND $¥$T€M$ ❣❣❣
ⒾⓂⓄ ℬϒ $@❣♆¥ ♥
Attached Image(s) (click to enlarge)