I had used the SwingSpot indicator in the original SwingSpot Progression thread with several other indicators, but that became too cluttered and became way overcomplicated. The indicator is originally based on a repainting ZigZag indicator that people were using to "attempt" to pick out the highs and lows on a chart. The SwingSpot indicator (ZigZag), as everyone already knows, is severely flawed because it grossly repaints and would redraw the arrows whenever a new high or low was made. Obviously, most experienced traders wouldn't touch it with a 10 foot pole, but then I got to thinking, and after a few weeks, it hit me. So I had a buddy code re-code it so at the close of a candle it would permanently leave the previous arrows on the chart as each new high or low was made and I had him change the arrows into boxes so it was a little more clean looking.
As I stared blankly at it over and over for a several weeks, I started to catch on that after a few strings of boxes and as the market does (like clockwork), we would have a strong correction in price. Then I thought, if we were to use a milder progressive lot sequence that would slightly increase as we added more boxes on to it, we could essentially turn it into a "basket" of trades in which we could code up an EA to place the trades, then monitor the overall profitability of the whole "basket". Once the equity in the "basket" reaches a certain dollar amount, the EA would close all the trades at once. I already have an EA that almost does what I need it to do, except it waits until the opposite colored box to close trades, but it's a start. If anyone wants to take a crack at re-working it, I'll post it here for you.
The other option was to have certain "sets" of trades and assign a percentage to them where if say 80% of the basket was positive we would close out the basket (in all reality, we only need around 50% of the basket to be in profit for us to make money). I'm still mulling over charts to determine how many trades per set and what would be the best way to close them out based on the number of trades in each set.
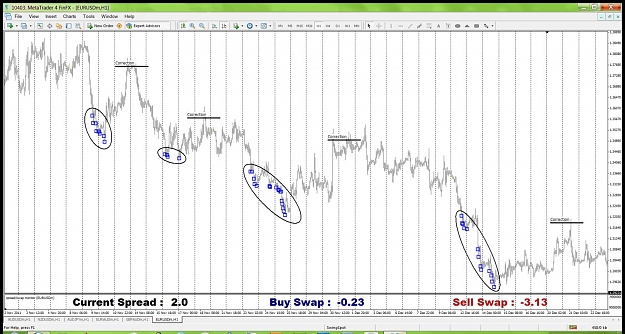
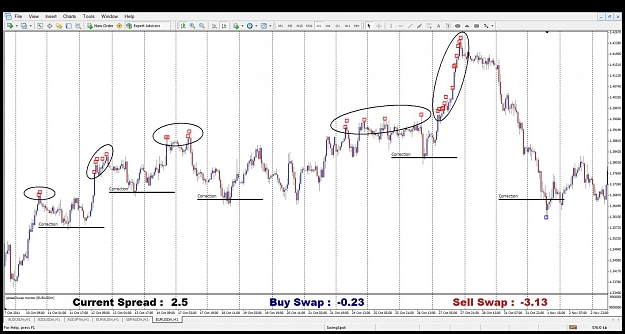
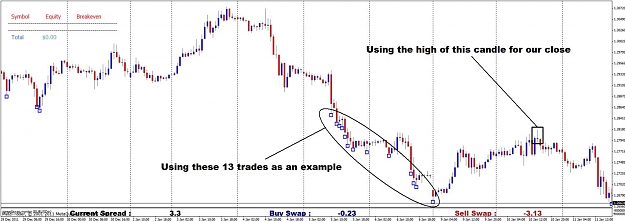
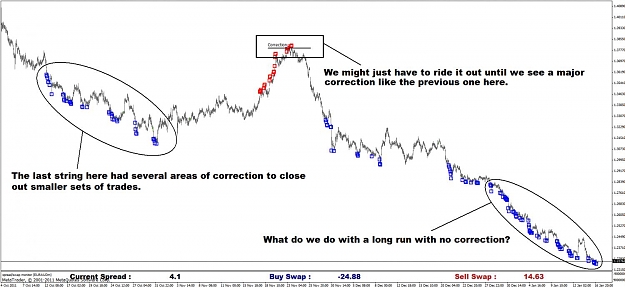
I've attached a few pics of what the indicator looks like on the chart. As you can see in pic 1, you can see the string of boxes and then a correction. And just in case you're wondering, this is not a hand picked chart as I can throw almost any chart up and you can see the same reaction on any pair. Most of the time the correction surpasses the whole string of boxes or we may only catch the majority of the string. For example, looking at the last sequence of 13 boxes on the chart in pic 1, if the first trade started at say .1 lots, and we progressively increased it to 1.3 lots (adding .1 lot to each new box), we would have easily made profit because all the larger trades below that particular correction point would overshadow the smaller trades above the correction point. In pic #2 are some short "basket" examples from back in October, All potentially profitable!
My original idea was to enter on each box with a progressively higher lot size and then close all the trades when an opposite colored box appeared and use it on a higher time frame, like a daily chart, and trade with the positive swap. I soon found out that after some sequences that would go 40, 50, and even 60 or more boxes without seeing an opposite signal, that I was thinking along the wrong path and I scrapped the project until now. I hope that we all can delve into this as I almost think that this could be as good as, if not better than, my Synergy strategy.
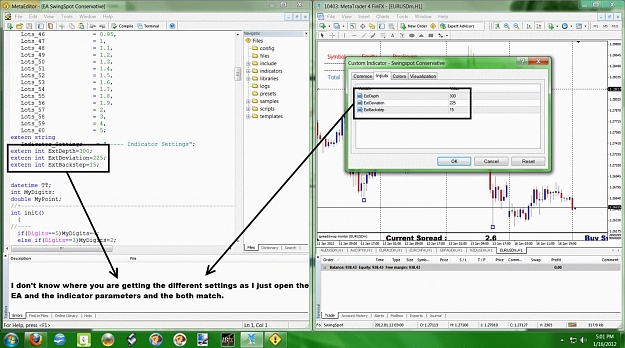
I have attached the zigzag indicator (which I've modified and called it SwingSpot Conservative) along with an indicator called i-breakeven than monitors the total equity of all the open trades on the chart. Maybe it can give us some code that can be inserted in the new EA code. I'm also posting the EA that I mentioned above that places trades and closes them on the opposite signal, so if anyone else wants to play with the code used in that one to see if it can be modified, it's all yours. Just a warning, I've noticed that if you scroll back through the charts the SwingSpot indicator will go a little haywire showing boxes all over the place. If you've saved a template of the chart, reload the template to fix the chart. I'm no coder, so I don't know how to clean up the code for it to work any smoother. Hopefully someone can step up and figure out why it's so rough.
***I really want to try and concentrate on exit strategies using the equity factor of the basket or a percentage based exit. not slap a dozen worthless indicators on the chart to try and find different entry methods. That didn't work before and it probably will not work now, so please refrain from doing so unless it's on your own time. Let's keep the discussion civil and constructive. Anyone who doesn't think this method is any good or wants to stop in just to make negative comments, just turn right around a go visit someone else's thread, negativity is not wanted in here, period!!!!.***
---------------------------------------------------------------------------------------------------------------------------------------------
*** I've updated post #1 with the SwingSpot Reloaded indicator and Swing Exit indicator. The SwingSpot Reloaded indicator is now a modified Semaphor indicator that is much more stable when scrolling back through the charts. We've also adjusted the Swing exit settings to 36-15-9 to allow for quicker exits. The i-breakeven is there to let you know at what point the basket will be at breakeven. An EA is currently being worked on and I will updated post #1 upon it's completion***