Hi there,
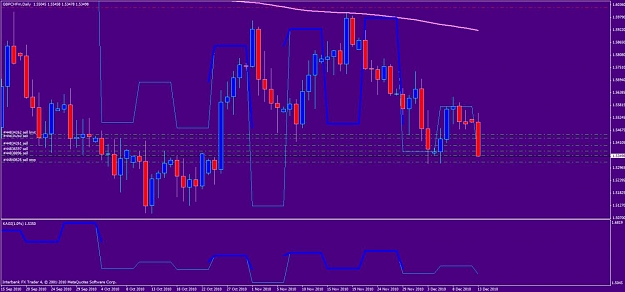
Lately I've been researching about Kagi/Key Charts and I think that it has a huge potential. I found a very simple indicator that translate ordinary candlestick/bar chart to kagi chart. But the fact that Kagi Charts completely ignores time, it become slightly inconvenience to trade intraday.
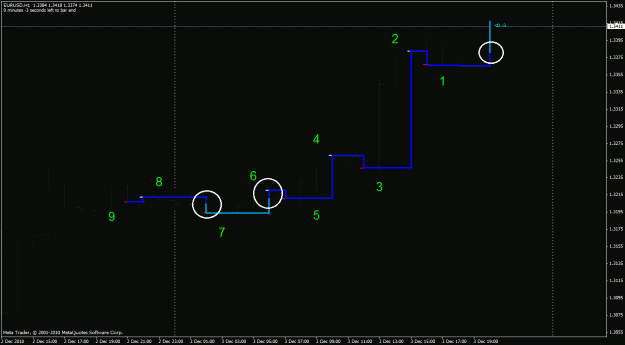
A little introduction of Kagi (as simple as possible)
Lately I've been researching about Kagi/Key Charts and I think that it has a huge potential. I found a very simple indicator that translate ordinary candlestick/bar chart to kagi chart. But the fact that Kagi Charts completely ignores time, it become slightly inconvenience to trade intraday.
A little introduction of Kagi (as simple as possible)
- Completely ignores time
- Each shoulder/waist refers to the highest close and lowest close
- The thick line is Yang while the thin line is Yin.
- Buy the Yang and sell the Yin
- Yang painted when the price break the previous Shoulder (highest close)
- Yin is painted when the price break the previous Waist (lowest close)
http://img262.imageshack.us/img262/1809/73836150.gif
http://img163.imageshack.us/img163/8167/eu1.gif
I would be glad if someone could modify the indicator just like below (i edited the chart using MS Paint)
Blue line as Yang and Turquoise line as Yin
(refer the chart on attachment)
Simply paint all the shoulder/waist and yang/yin on the bar chart.
An alert when the line (yang/yin) changes to one another would be a bonus
Thanks in advance
Attached Image (click to enlarge)
Attached File(s)